Katrina. Maria. Andrew. Haiyan.
Hurricanes are the most violent storms on the planet. The names of the most damaging ones live on because of the devastation they left in their wake.
Known outside of North America as tropical cyclones or typhoons, hurricanes are essentially massive engines of wind and rain that are fueled by warm ocean water and air.
This heat energy is converted into lashing winds and driving rainfall that can bring devastating impacts when they hit cities, homes and infrastructure.
Over the last two-plus centuries, human activity — mainly the burning of fossil fuels – has added lots of heat to the oceans and air where these storms are spawned.
The 2020 Atlantic hurricane season was the most active on record, and many of the storms that slammed into the Gulf Coast, Central America and the Caribbean this year exhibited hallmark signs that they were supercharged by global warming.
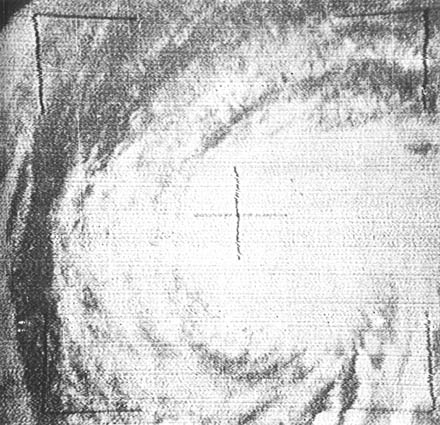
In 1961, Hurricane Esther became the first storm to be recorded by a weather satellite.
NASA
Though global temperature data goes back over 150 years, hurricane records are actually very sparse prior to the 1970s, when satellites first began capturing images of all of the world’s oceans.
While scientists are still learning exactly how this added heat is changing hurricanes, research shows that the storms are becoming more destructive in some key ways.
Here’s what scientists are most confident is happening to hurricanes as a result of climate change, what they think might be occurring and the biggest questions about how these massive storms are changing that remain unanswered.
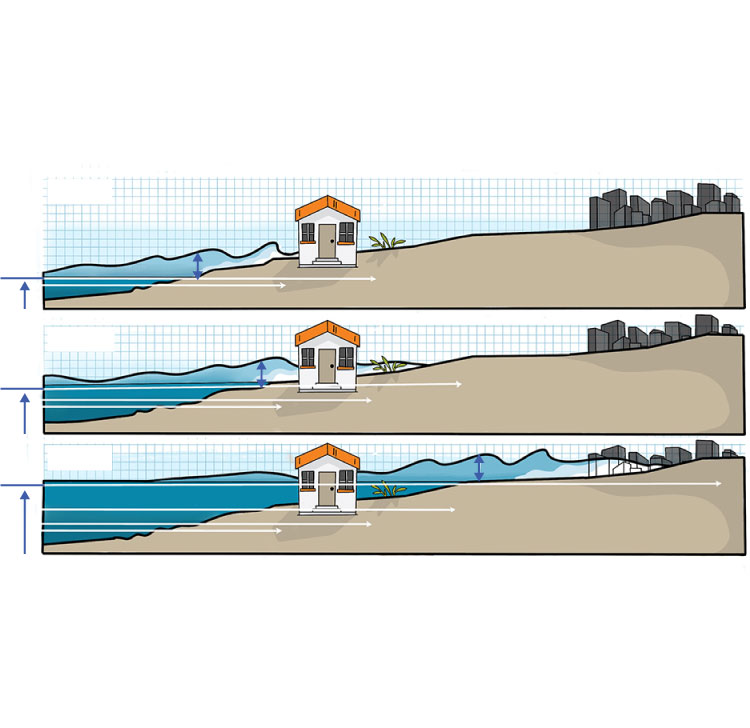
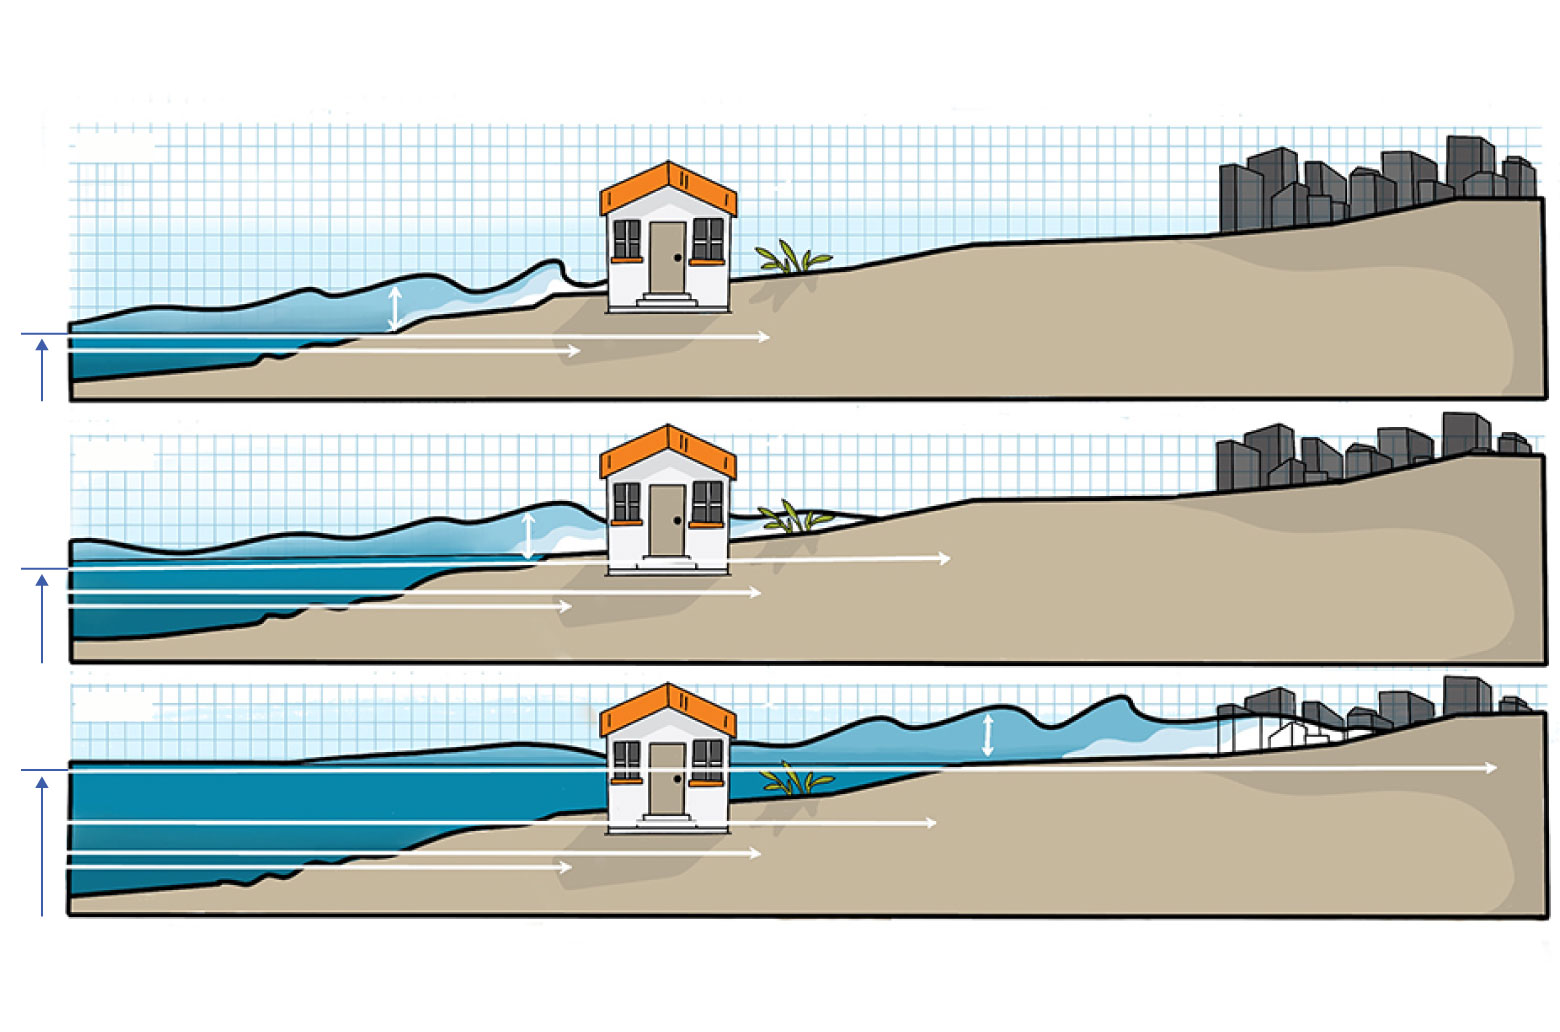
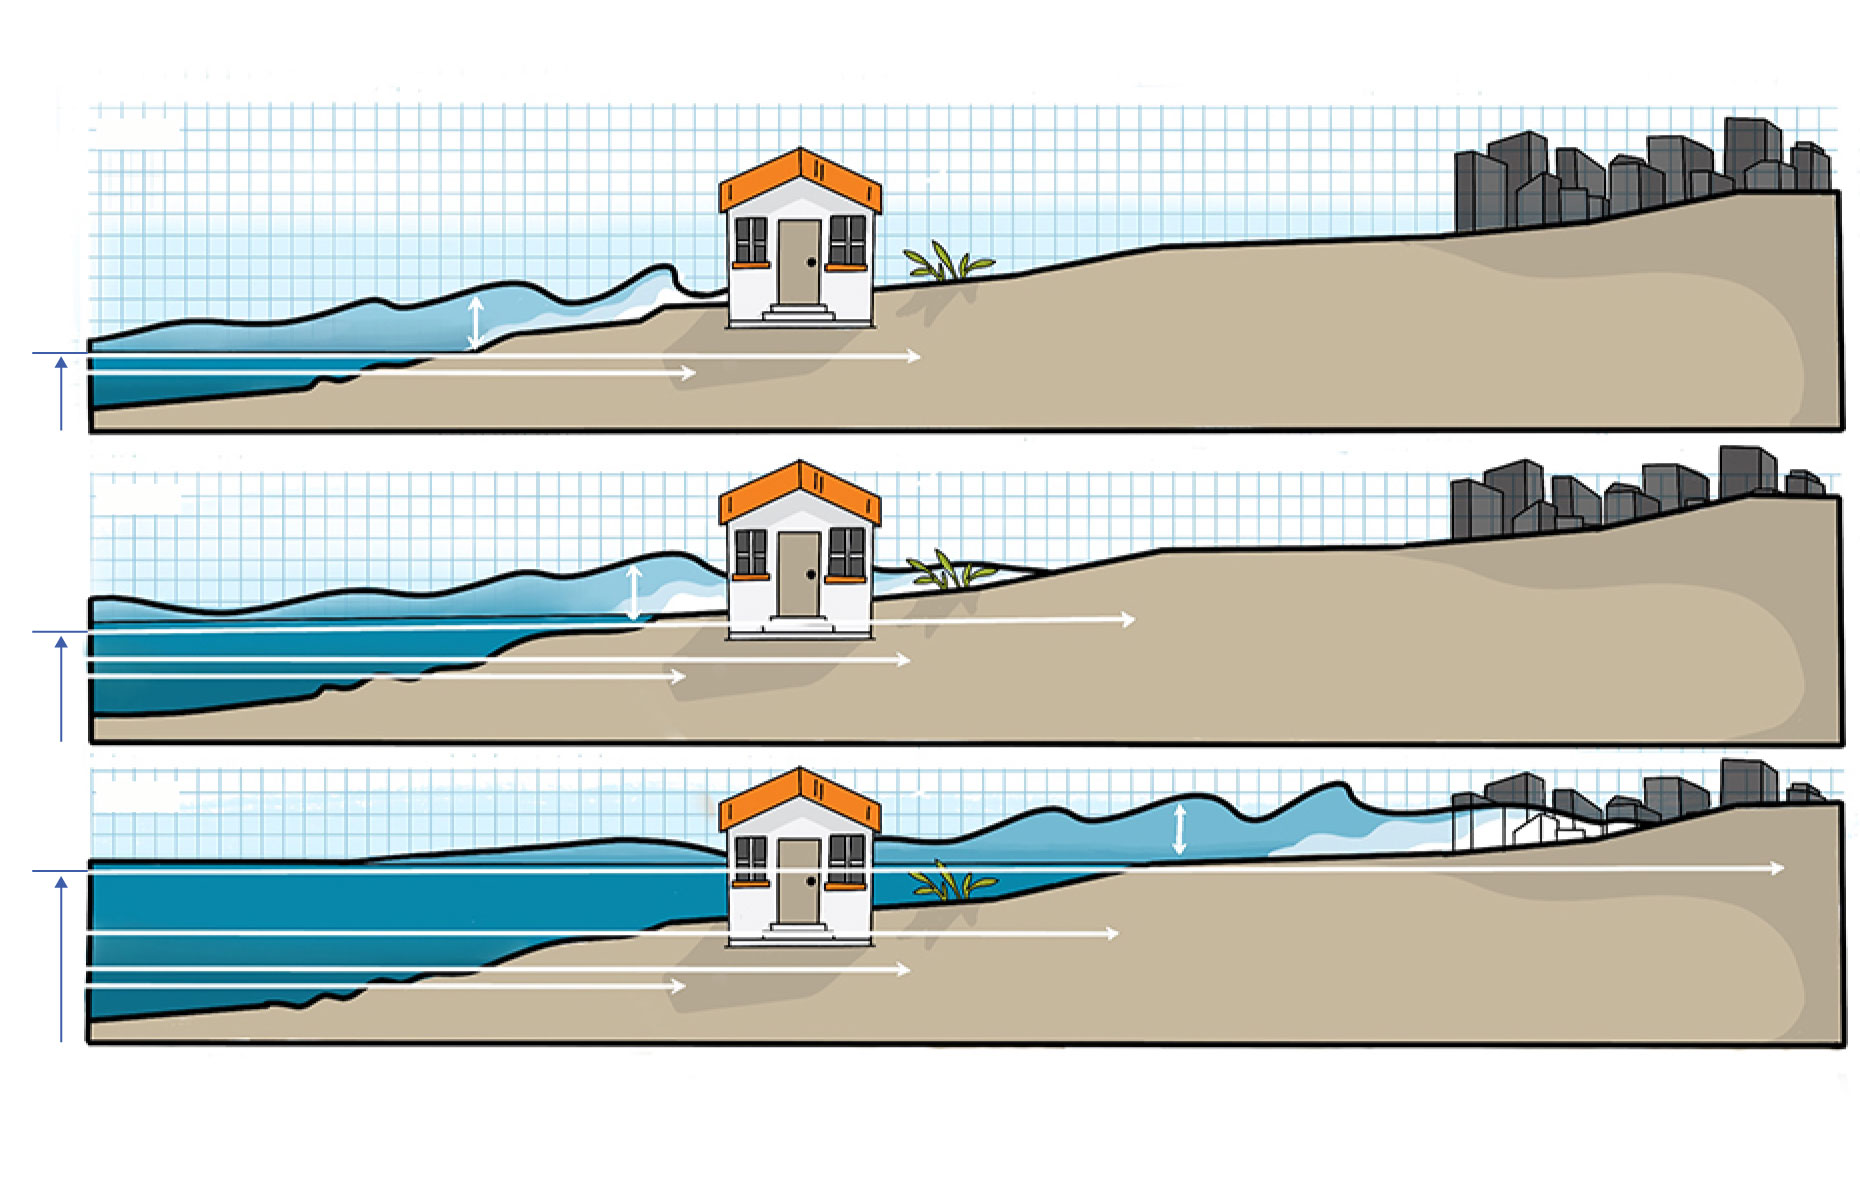
Sea level rise is making storm surge more dangerous
Hurricanes are categorized by their wind speeds, but the most deadly and destructive threat posed by most hurricanes is the storm surge they can produce.
Storm surge is the rapid rise in ocean levels brought about by the powerful winds and low pressure in a hurricane.
When a storm’s winds blow onshore, they can send feet of water rushing inland at depths far greater than even the most extreme high tides.
And when storm surge strikes a developed coastline, the cost in both lives and property can be enormous.
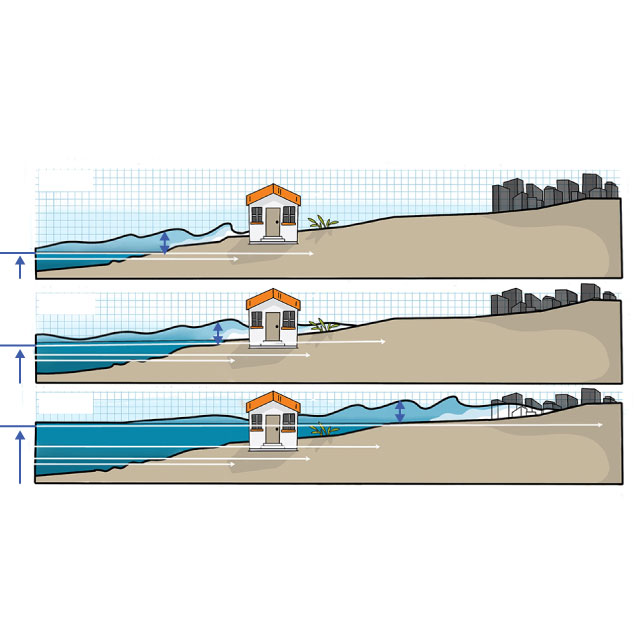
With global sea levels projected to rise this century, the risk of storm surge penetrating further inland will increase.
2010
High
tide
Storm surge
2010 floodplain
1880 floodplain
2050
2050 floodplain
2010
1880
2100
2100 floodplain
2050
2010
1880
Note: Local factors such as tides and coastal profile will influence the extent of the floodplain.
Source: Union of Concerned Scientists
With global sea levels projected to rise this century, the risk of storm surge penetrating further inland will increase.
2010
High
tide
Storm surge
2010 floodplain
1880 floodplain
2050
Storm surge
2050 floodplain
2010
1880
2100
Storm surge
2100 floodplain
2050
2010
1880
Note: Local factors such as tides and coastal profile will influence the extent of the floodplain.
Source: Union of Concerned Scientists

More than 1,800 lives were lost when Hurricane Katrina hit southern Louisiana in 2005, and many of those who died fell victim to storm surge, according to NOAA.
While no tide gauge measurements were available in the hardest-hit parts of the Bahamas when Hurricane Dorian struck in 2019, witnesses reported that the storm put parts of the islands under as much as 20 feet of water.
During the height of Hurricane Dorian, Michael Pintard, Bahamas’ Minister of Agriculture, recorded this video from the second story of his house. Water is seen lapping against the windows, which he estimates in the video to be nearly 20 feet high.
Sea level rise of only a couple of inches can make a dramatic difference in how far inland storm surge can travel.
Already, storm surge has gotten worse because sea levels are rising - and fast.
Since 1880, global sea levels have risen by an average of 8 to 9 inches. Two-thirds of that increase has occurred in just the last two and a half decades, driven mainly by the rapid melting of the world’s ice sheets and glaciers.

DRUM
ISLAND
West Ashley
Mt. Pleasant
Charleston
Ashley R.
Charleston Harbor
JAMES ISLAND
JOHNS ISLAND
Atlantic Ocean
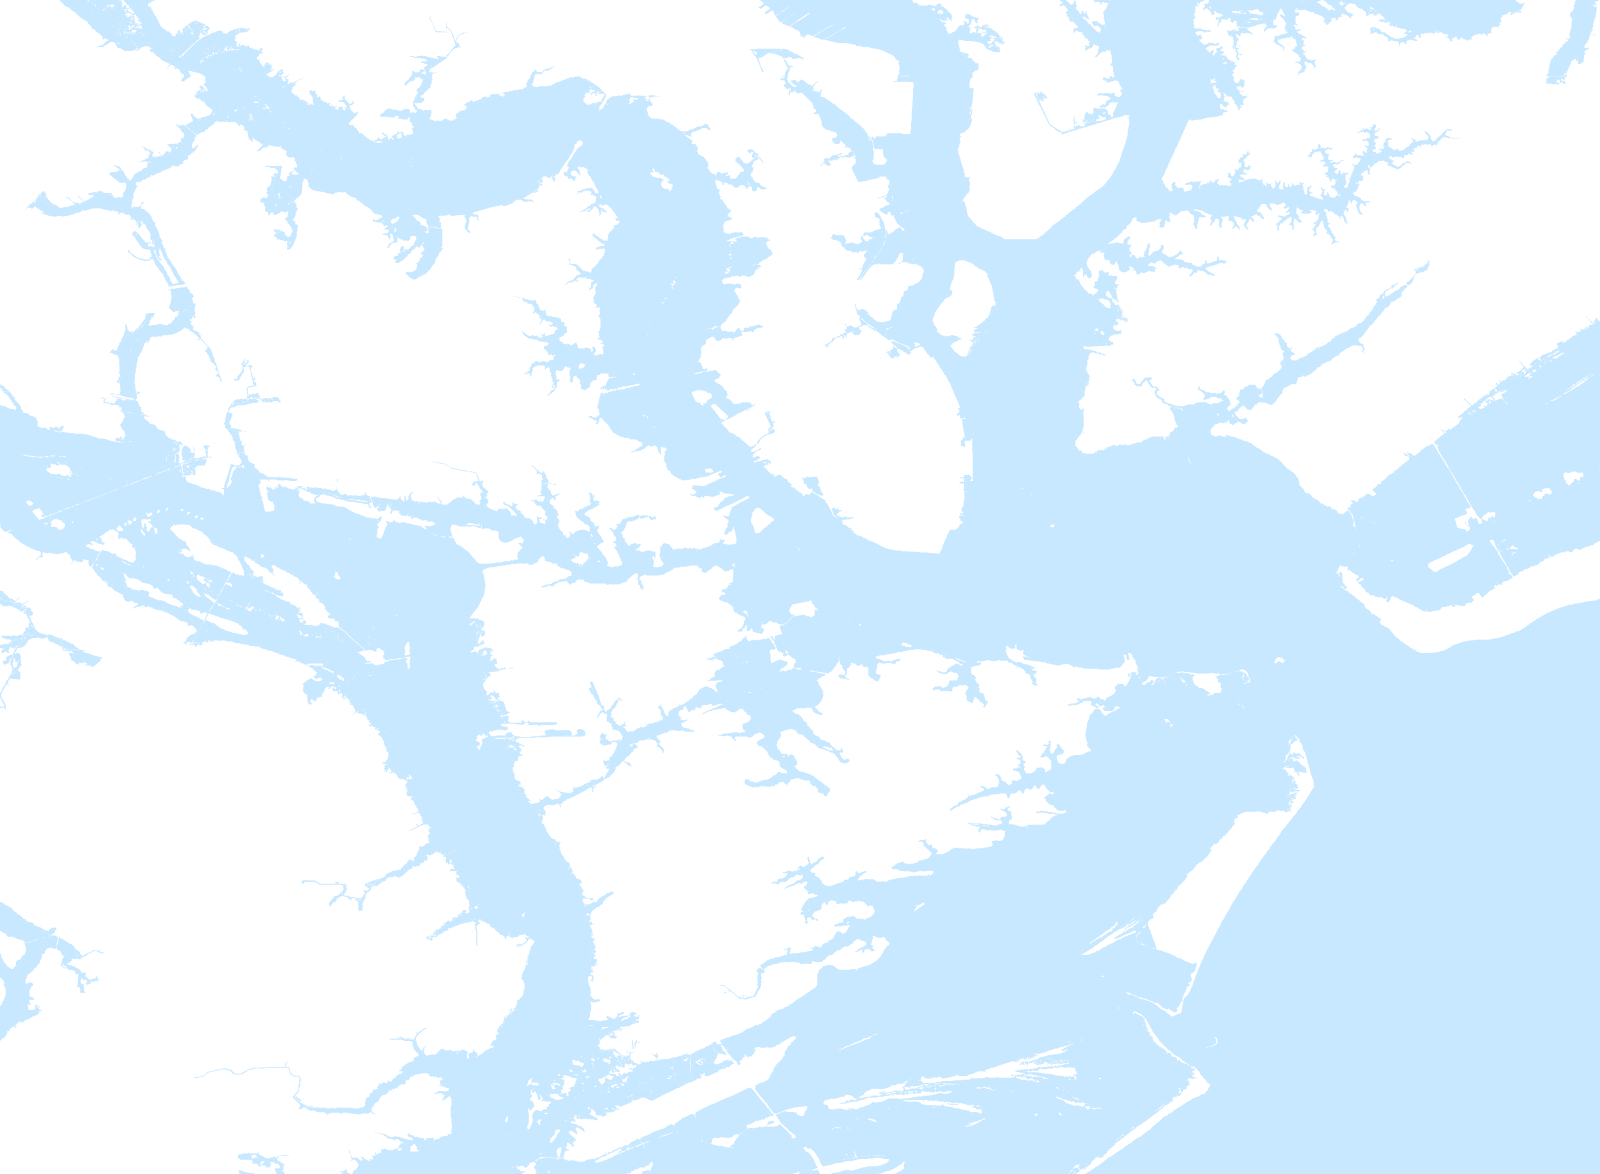
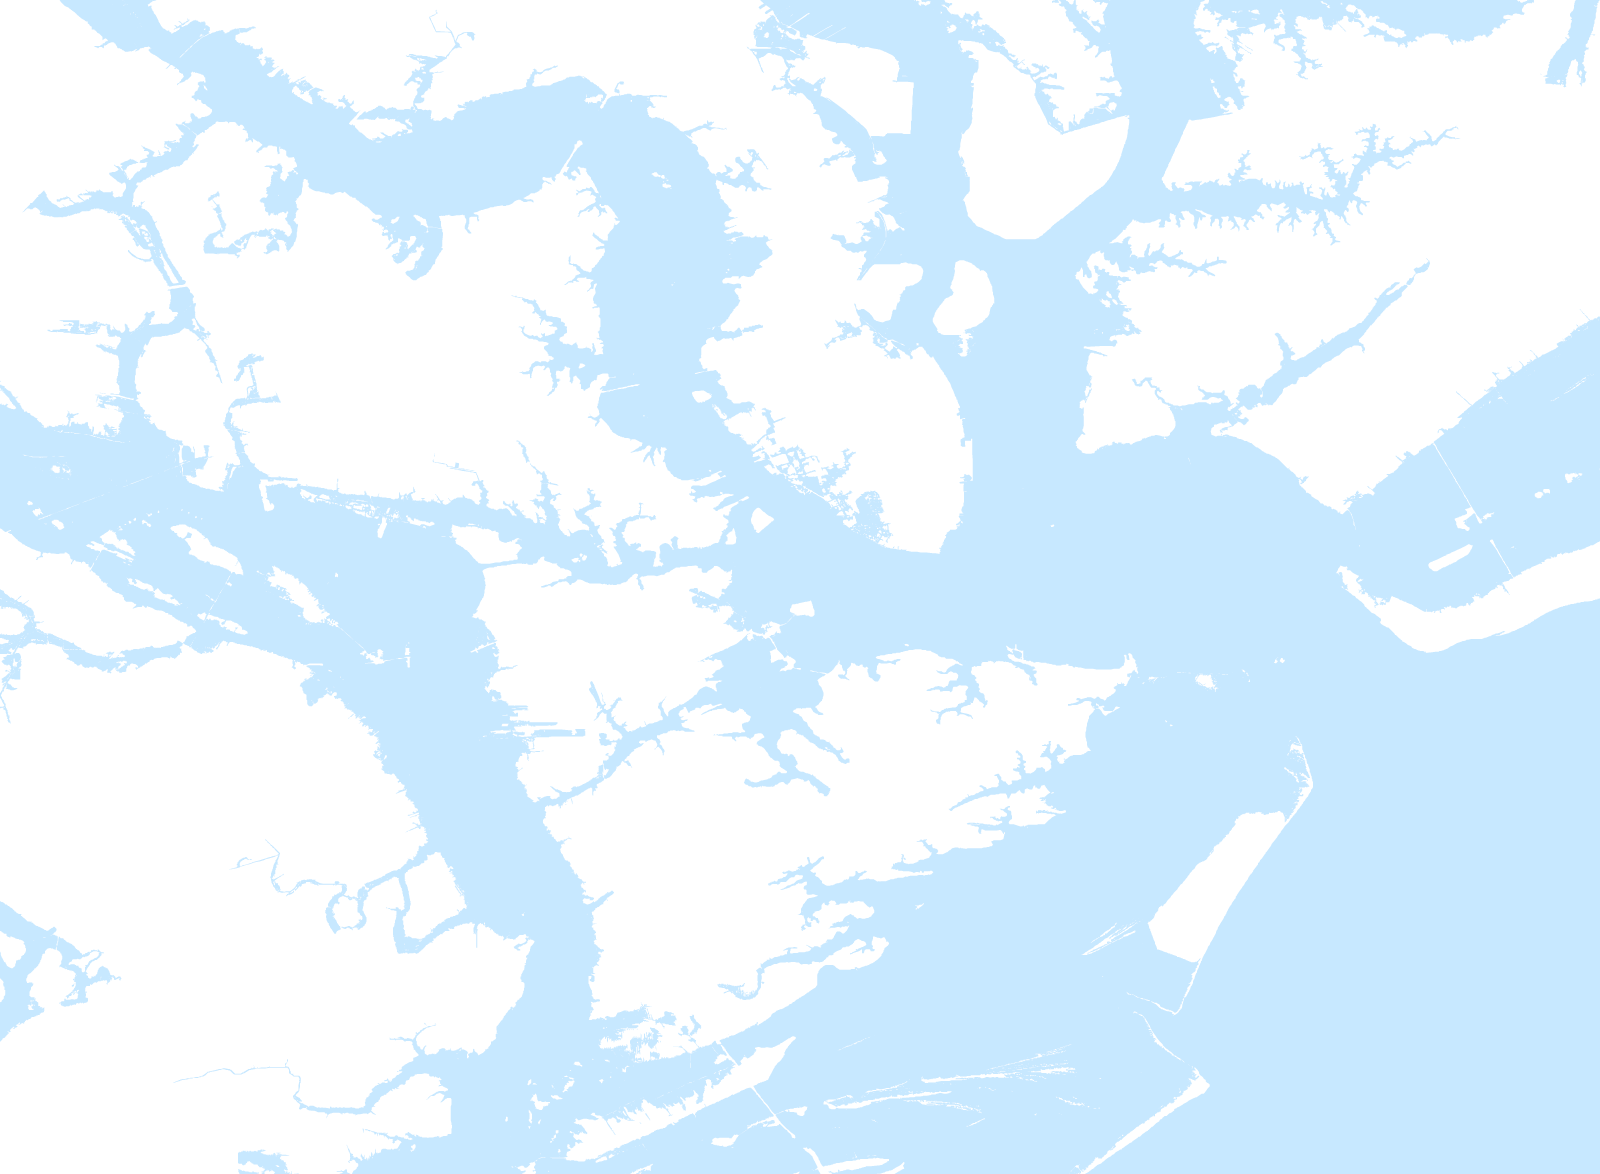
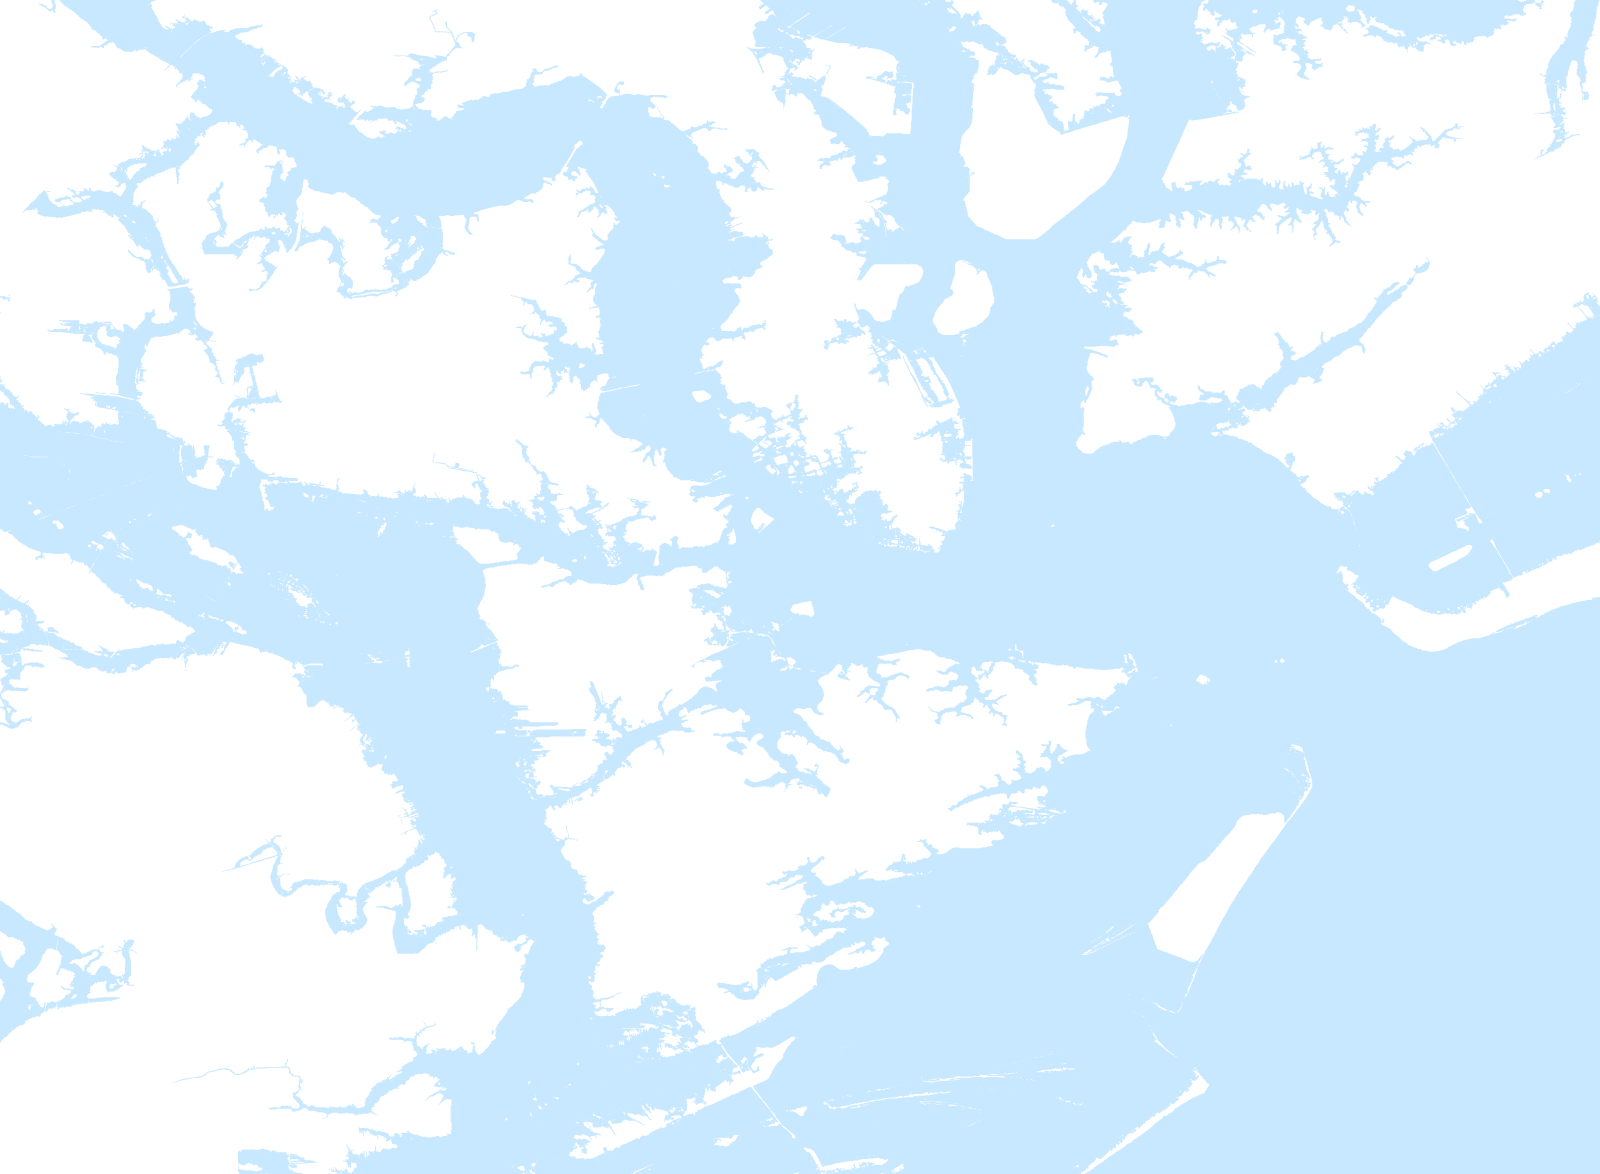
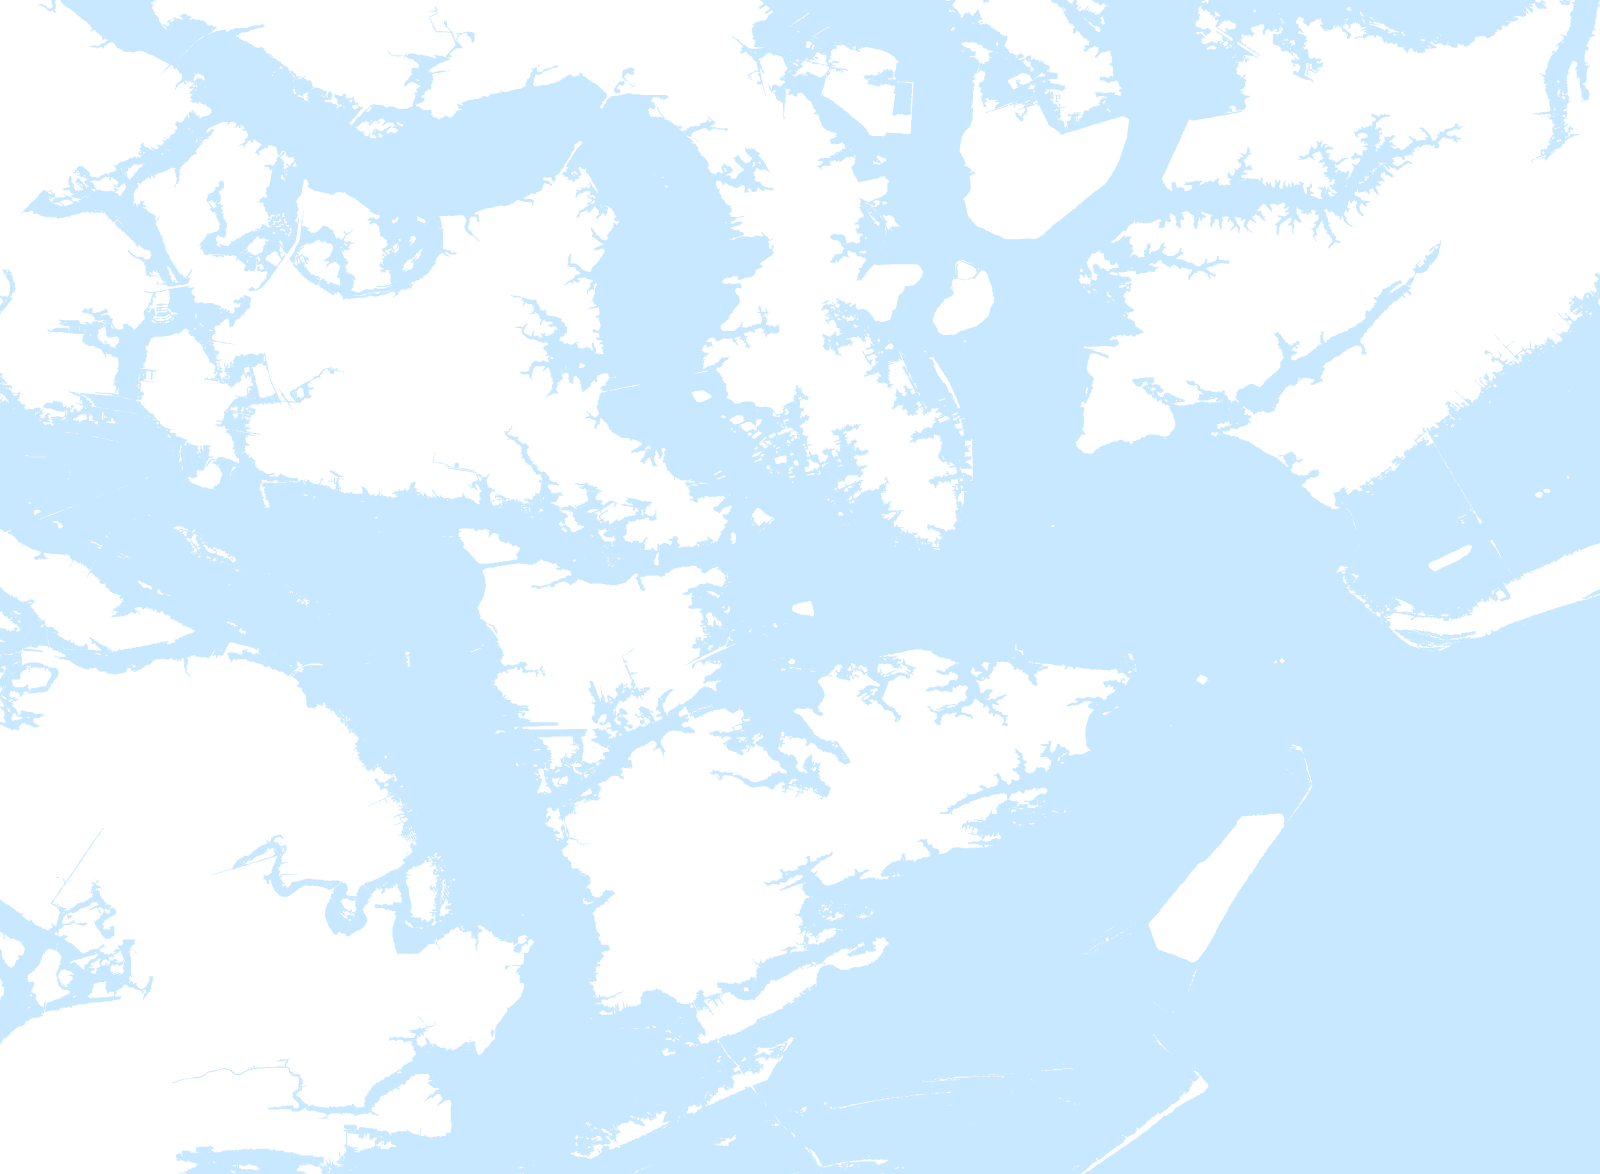
Low-lying cities like Charleston, South Carolina, are already vulnerable to storm surge.
Here's how the Charleston region looks today.
But with 1 foot of sea level rise, parts of it would be underwater.
Here's what 2 feet of sea level rise would look like.
And 3 feet …
And 4 feet …
As sea levels continue to rise this century, the storm surge risk to the city will also grow.
Scientists now say sea levels could rise by more than three feet by 2100.
“This is making the storms more dangerous as it leads to higher inundation levels,” said Tom Knutson, a meteorologist at the National Oceanic and Atmospheric Administration who leads the agency’s weather and climate dynamics division.
If humans continue to emit heat-trapping gases into the atmosphere, scientists expect that sea levels will climb even higher, putting major cities at an even greater risk.
Sea levels are now likely to rise more than 3 feet by 2100, according to the findings of a landmark report published last year by the UN’s Intergovernmental Panel on Climate Change.
Generally speaking, a rise in sea levels of 2 to 3 feet would mean that a Category 1 hurricane could be capable of inflicting the kind of storm surge damage we would expect today from a Category 2 storm.
In the Southeastern US alone, the annual cost of storm surge damage is projected to grow to $56 billion by 2050, according to the US government’s 2018 National Climate Assessment. And that’s even if global emissions of heat-trapping gases are moderately curbed in the next two decades.
Storms are getting wetter
While storm surge is responsible for about half of all fatalities in landfalling hurricanes, the heavy rainfall such storms produce can also be deadly. Since 1970, nearly 60% of the flood-related, non-storm-surge deaths from tropical storms have been caused by inland flooding.
Scientists are very confident that climate change is making hurricane deluges worse by increasing rainfall rates and the sheer amount of rain a storm can produce.
The increase in hurricane rainfall can be explained by physics — specifically, the Clausius-Clapeyron equation, which holds that for each degree Celsius of warming, 7% more water vapor should be available in the atmosphere to potentially fall as rain.
“Simply put, warmer air holds more water vapor,” said Jim Kossin, an atmospheric research scientist at NOAA’s National Center for Environmental Information.
That would mean that in a world warmed by two degrees Celsius, you would have, on average, around 14% more water vapor in the atmosphere.
Computer models consistently show that hurricane rainfall is increasing already, as one would expect as the planet warms.
But because observation stations that monitor rainfall are sparse and hurricane satellite data only goes back a few decades, we can’t yet draw conclusions about how much climate change has affected rainfall, said Kossin.
However, there have been several recent storms that provide anecdotal evidence.
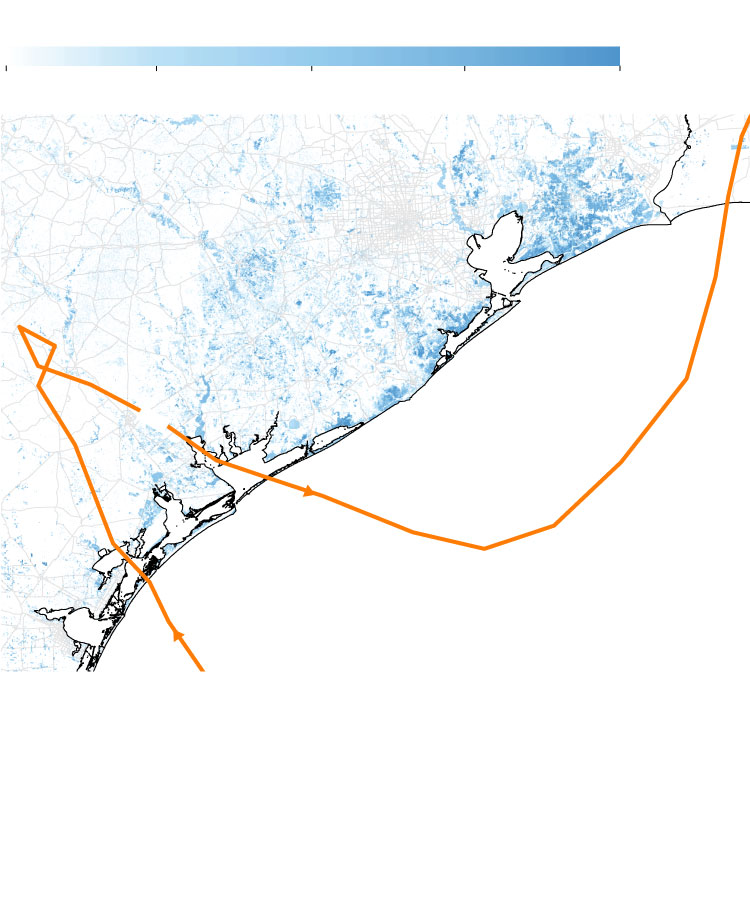
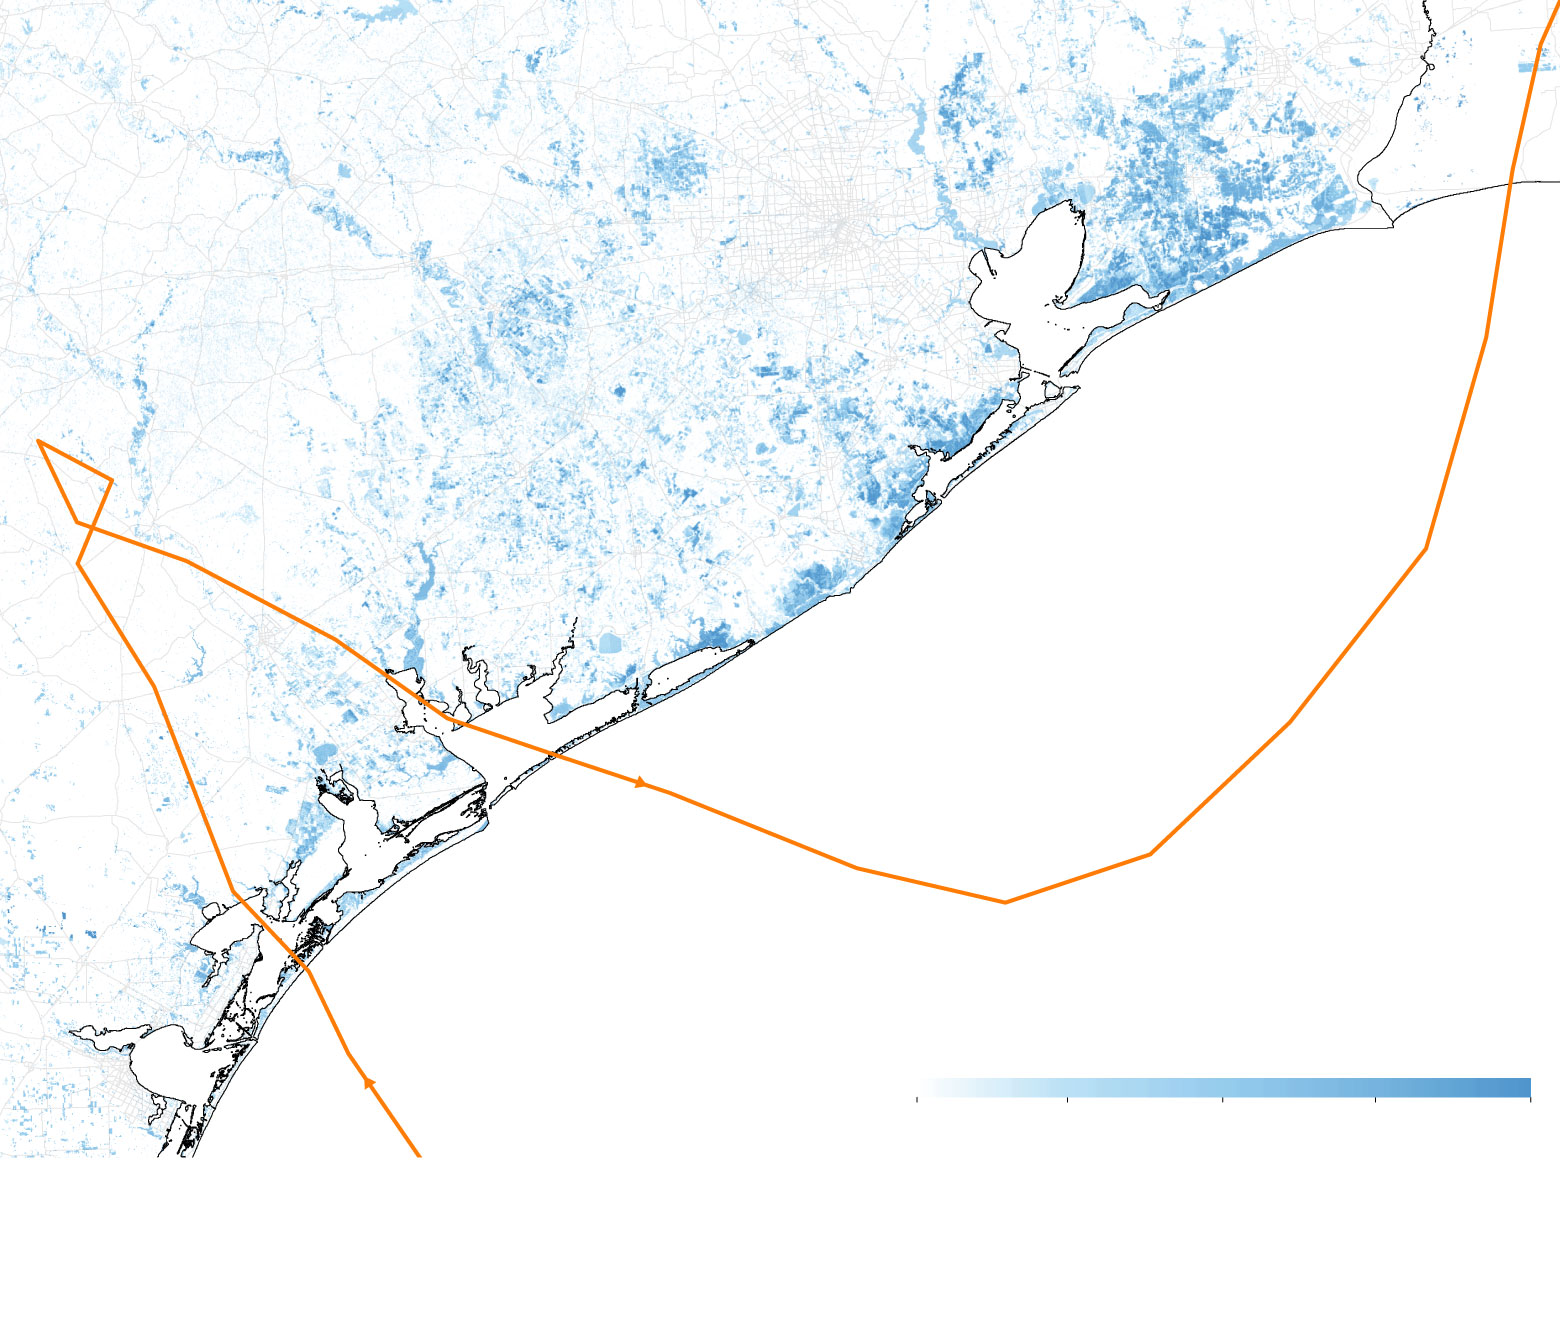
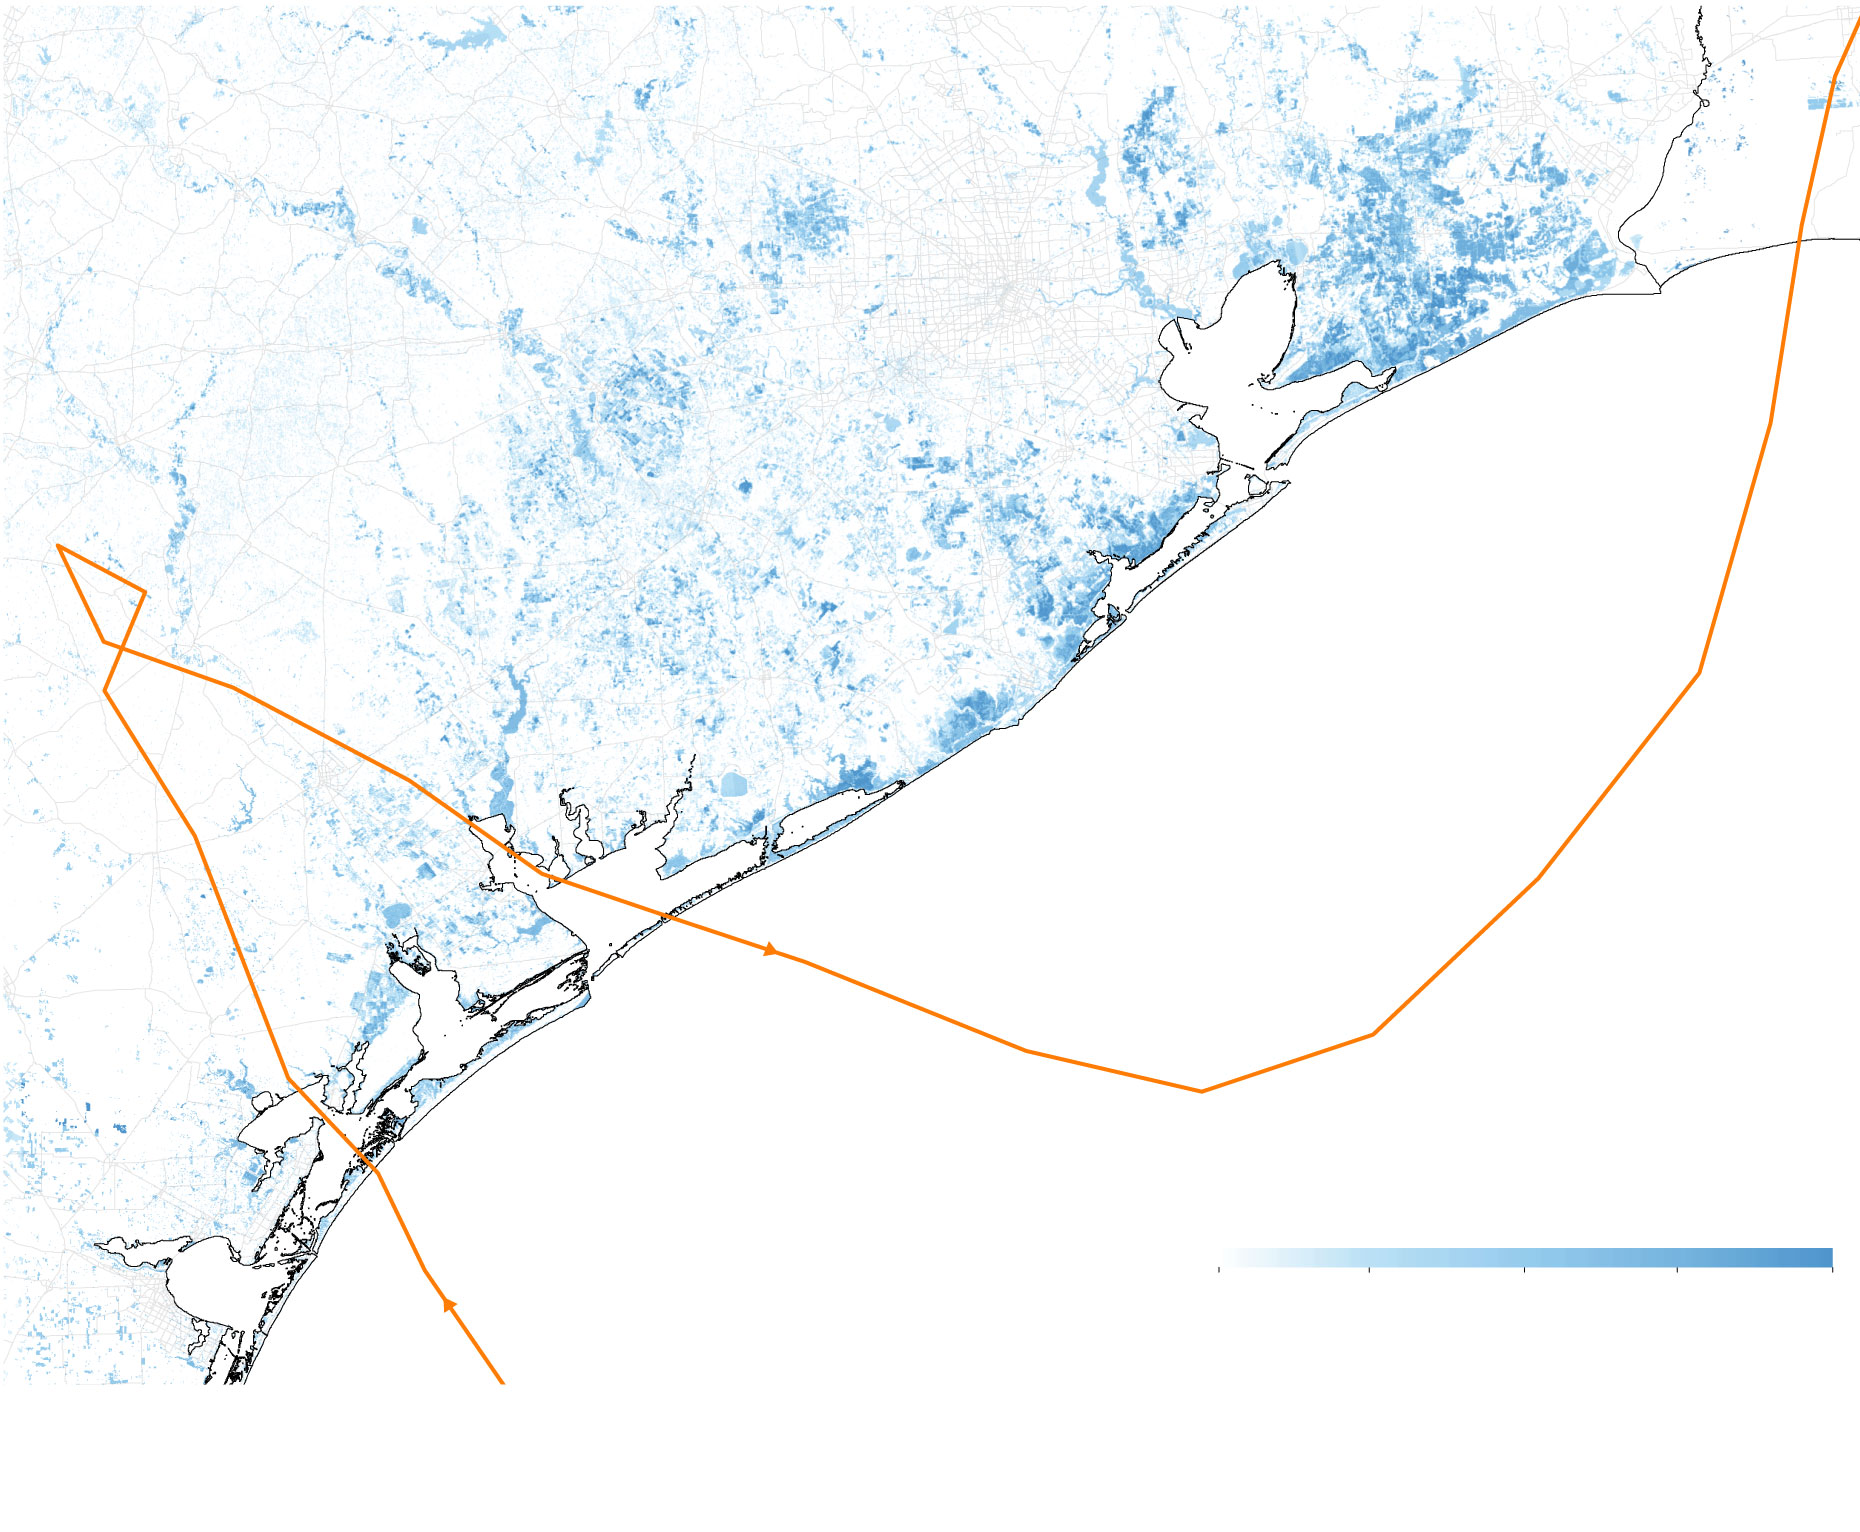
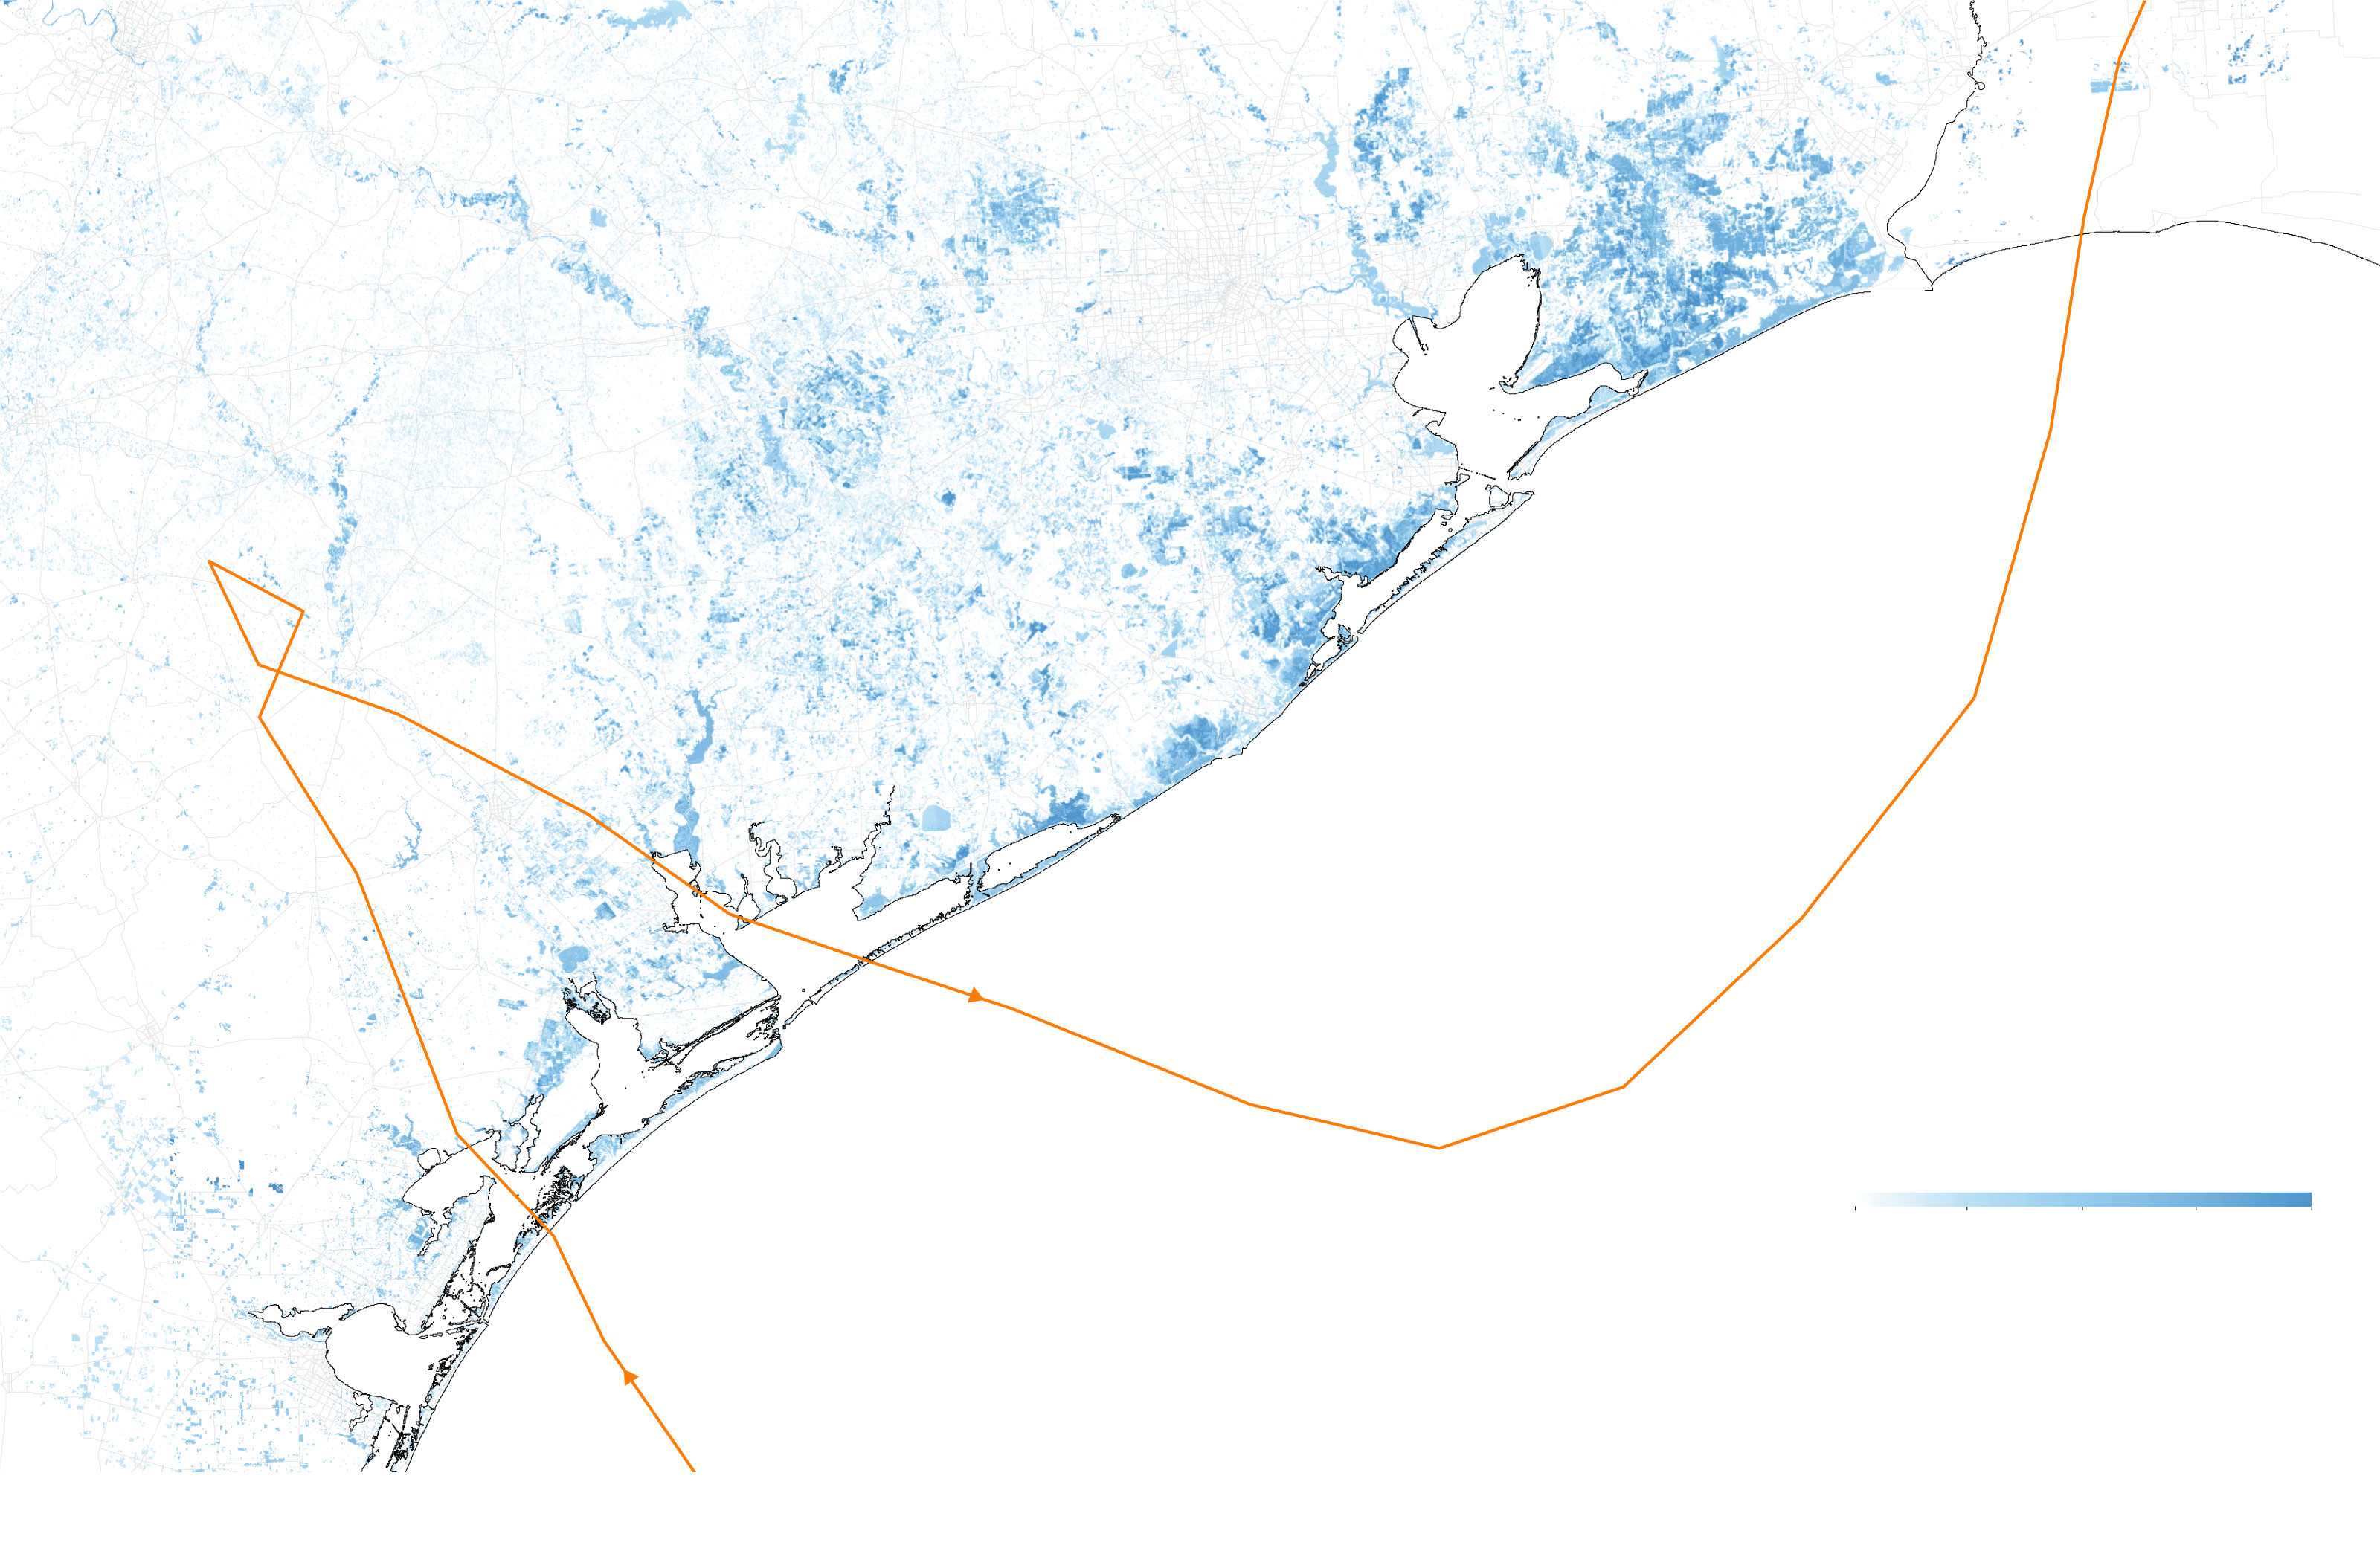
In 2017, Hurricane Harvey dumped the most rain ever recorded during any weather event in the US, with more than 40 inches falling during the storm’s four-day slog across Texas and Louisiana. Scientists estimated that Harvey’s incredible rainfall totals were made 15% more intense and three times more likely due to global warming.
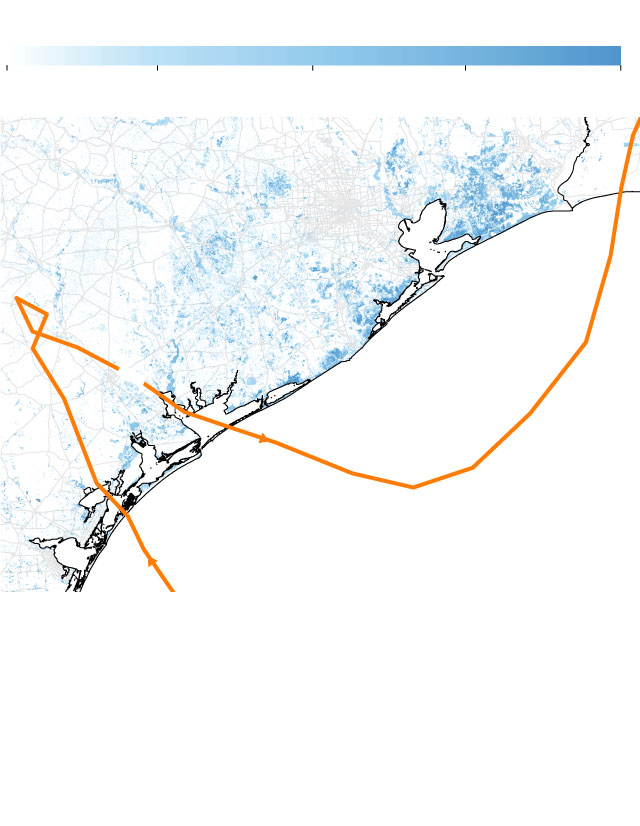
Flood detection percentage*
0
25
50
75
100
Beaumont
LA.
Houston
TEXAS
Galveston
Victoria
Harvey’s path
*Data represent the number of times a pixel was identified as ‘flooded’ divided by the number of times the pixel was sampled.
Sources: NOAA (Harvey’s path); NASA MSFC SPoRT, Copernicus EMS, MDA Systems, ARIA NASA JPL/Caltech via GeoPlatform.gov (flood analysis)
Beaumont
LA.
Houston
TEXAS
Galveston
Victoria
Harvey’s path
Flood detection percentage*
Corpus
Christi
25
50
75
0
100
*Data represent the number of times a pixel was identified as ‘flooded’ divided by the number of times the pixel was sampled.
Sources: NOAA (Harvey’s path); NASA MSFC SPoRT, Copernicus EMS, MDA Systems, ARIA NASA JPL/Caltech via GeoPlatform.gov (flood analysis)
Beaumont
LA.
Houston
TEXAS
Galveston
Victoria
Harvey’s path
Flood detection percentage*
0
25
50
75
100
Corpus
Christi
*Data represent the number of times a pixel was identified as ‘flooded’ divided by the number of times the pixel was sampled.
Sources: NOAA (Harvey’s path); NASA MSFC SPoRT, Copernicus EMS, MDA Systems, ARIA NASA JPL/Caltech via GeoPlatform.gov (flood analysis)
Beaumont
LOUISIANA
Houston
TEXAS
Galveston
Victoria
Harvey’s path
Flood detection percentage*
0
25
50
75
100
Corpus
Christi
*Data represent the number of times a pixel was identified as ‘flooded’ divided by the number of times the pixel was sampled.
Sources: NOAA (Harvey’s path); NASA MSFC SPoRT, Copernicus EMS, MDA Systems, ARIA NASA JPL/Caltech via GeoPlatform.gov (flood analysis)
The following year, Hurricane Florence swamped parts of North Carolina with nearly three feet of rain, shattering the state’s previous record for tropical storm rainfall.
Storms are getting stronger
The oceans are hotter than they have been in known history, and scientists know that a majority of the heat the Earth is absorbing as a result of greenhouse gases are going into the oceans.
This added heat is likely allowing hurricanes to pack even greater wind speeds.
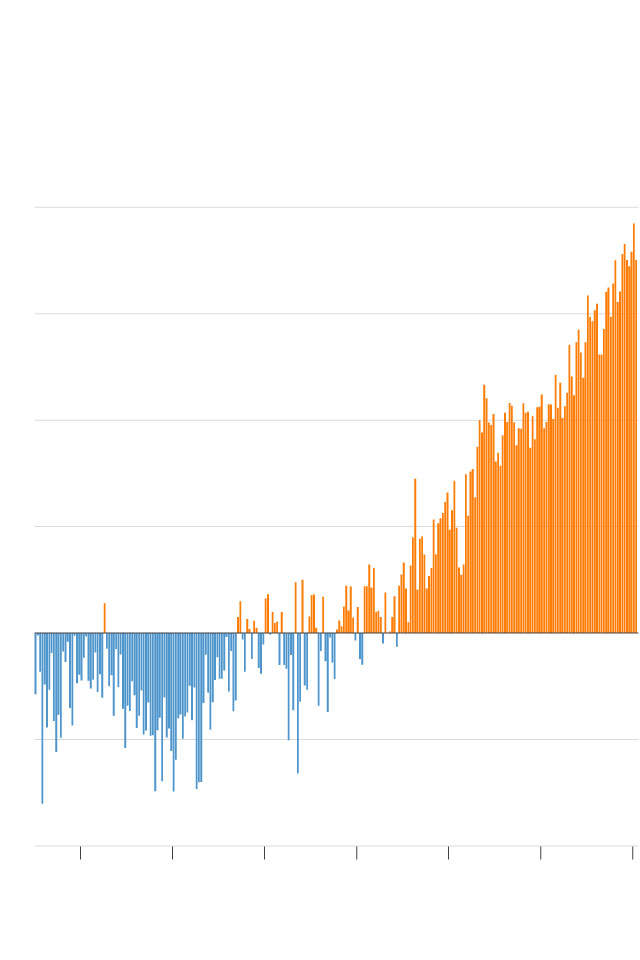
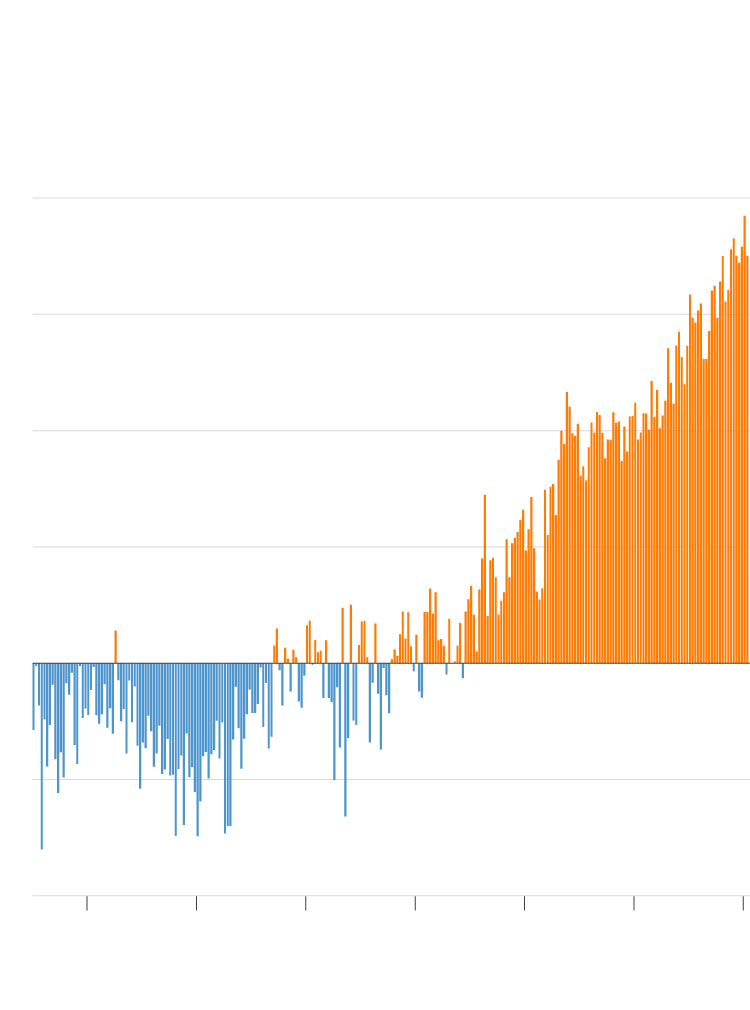
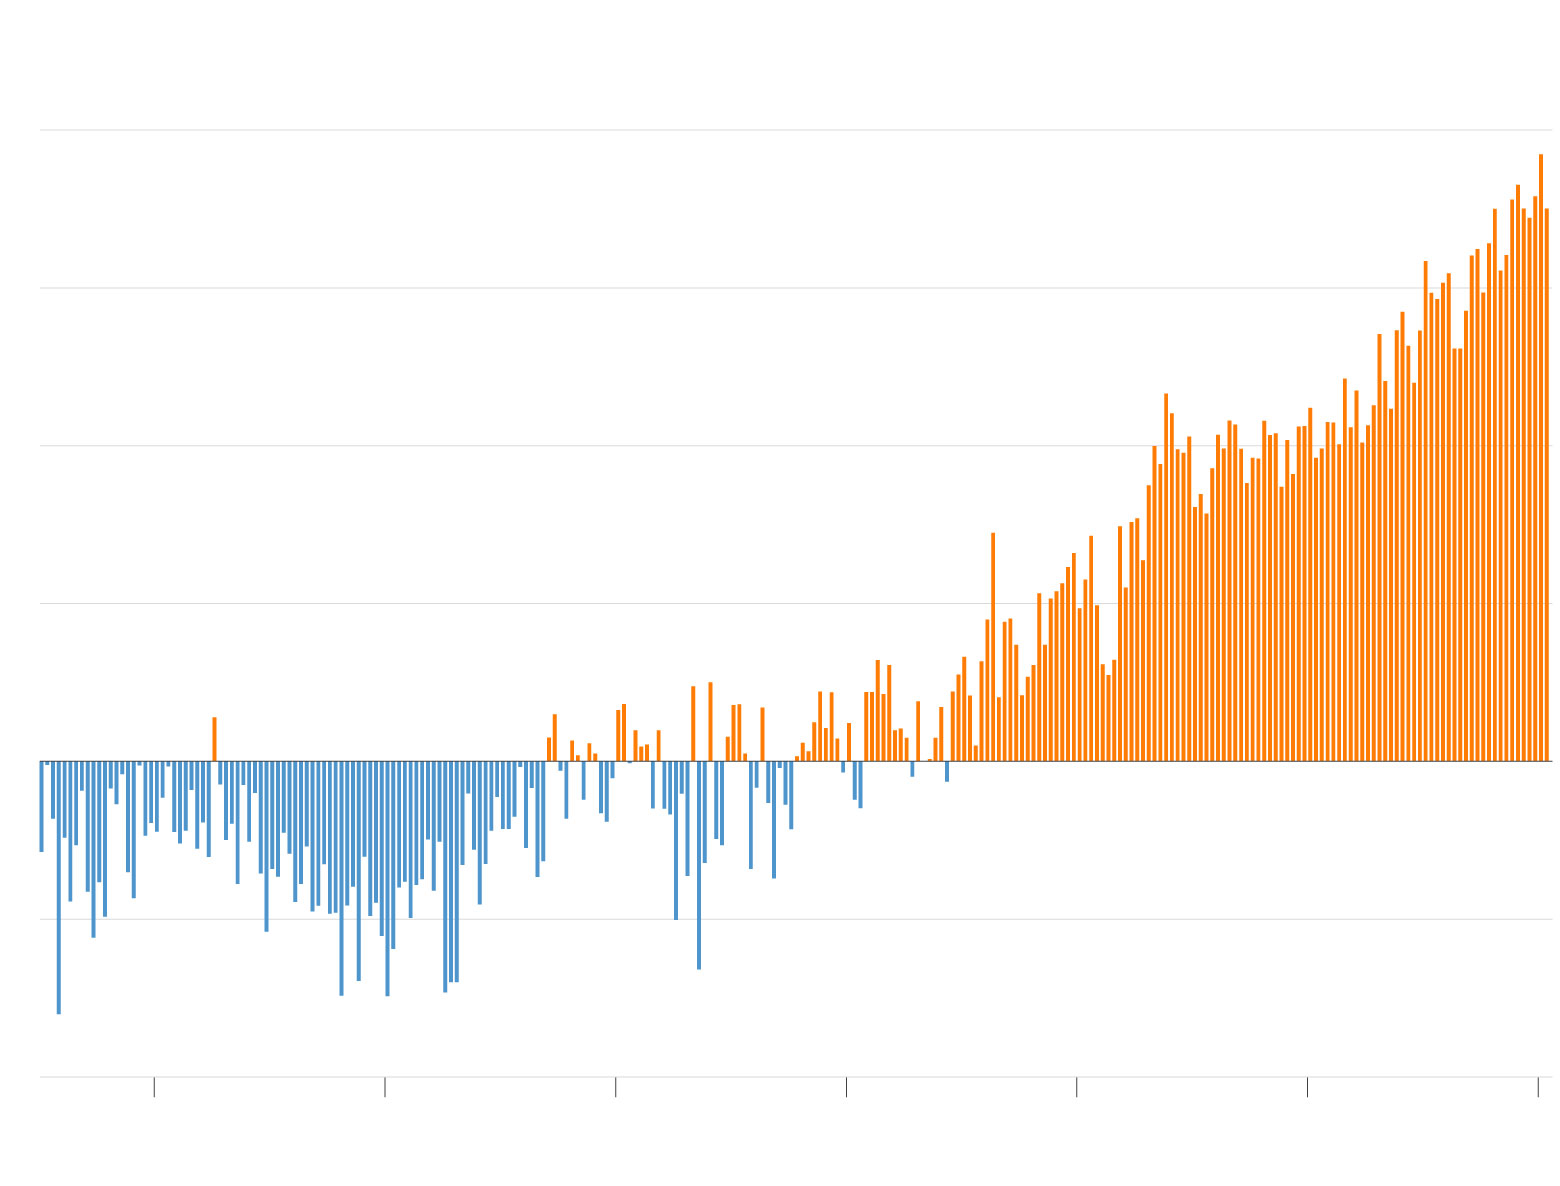
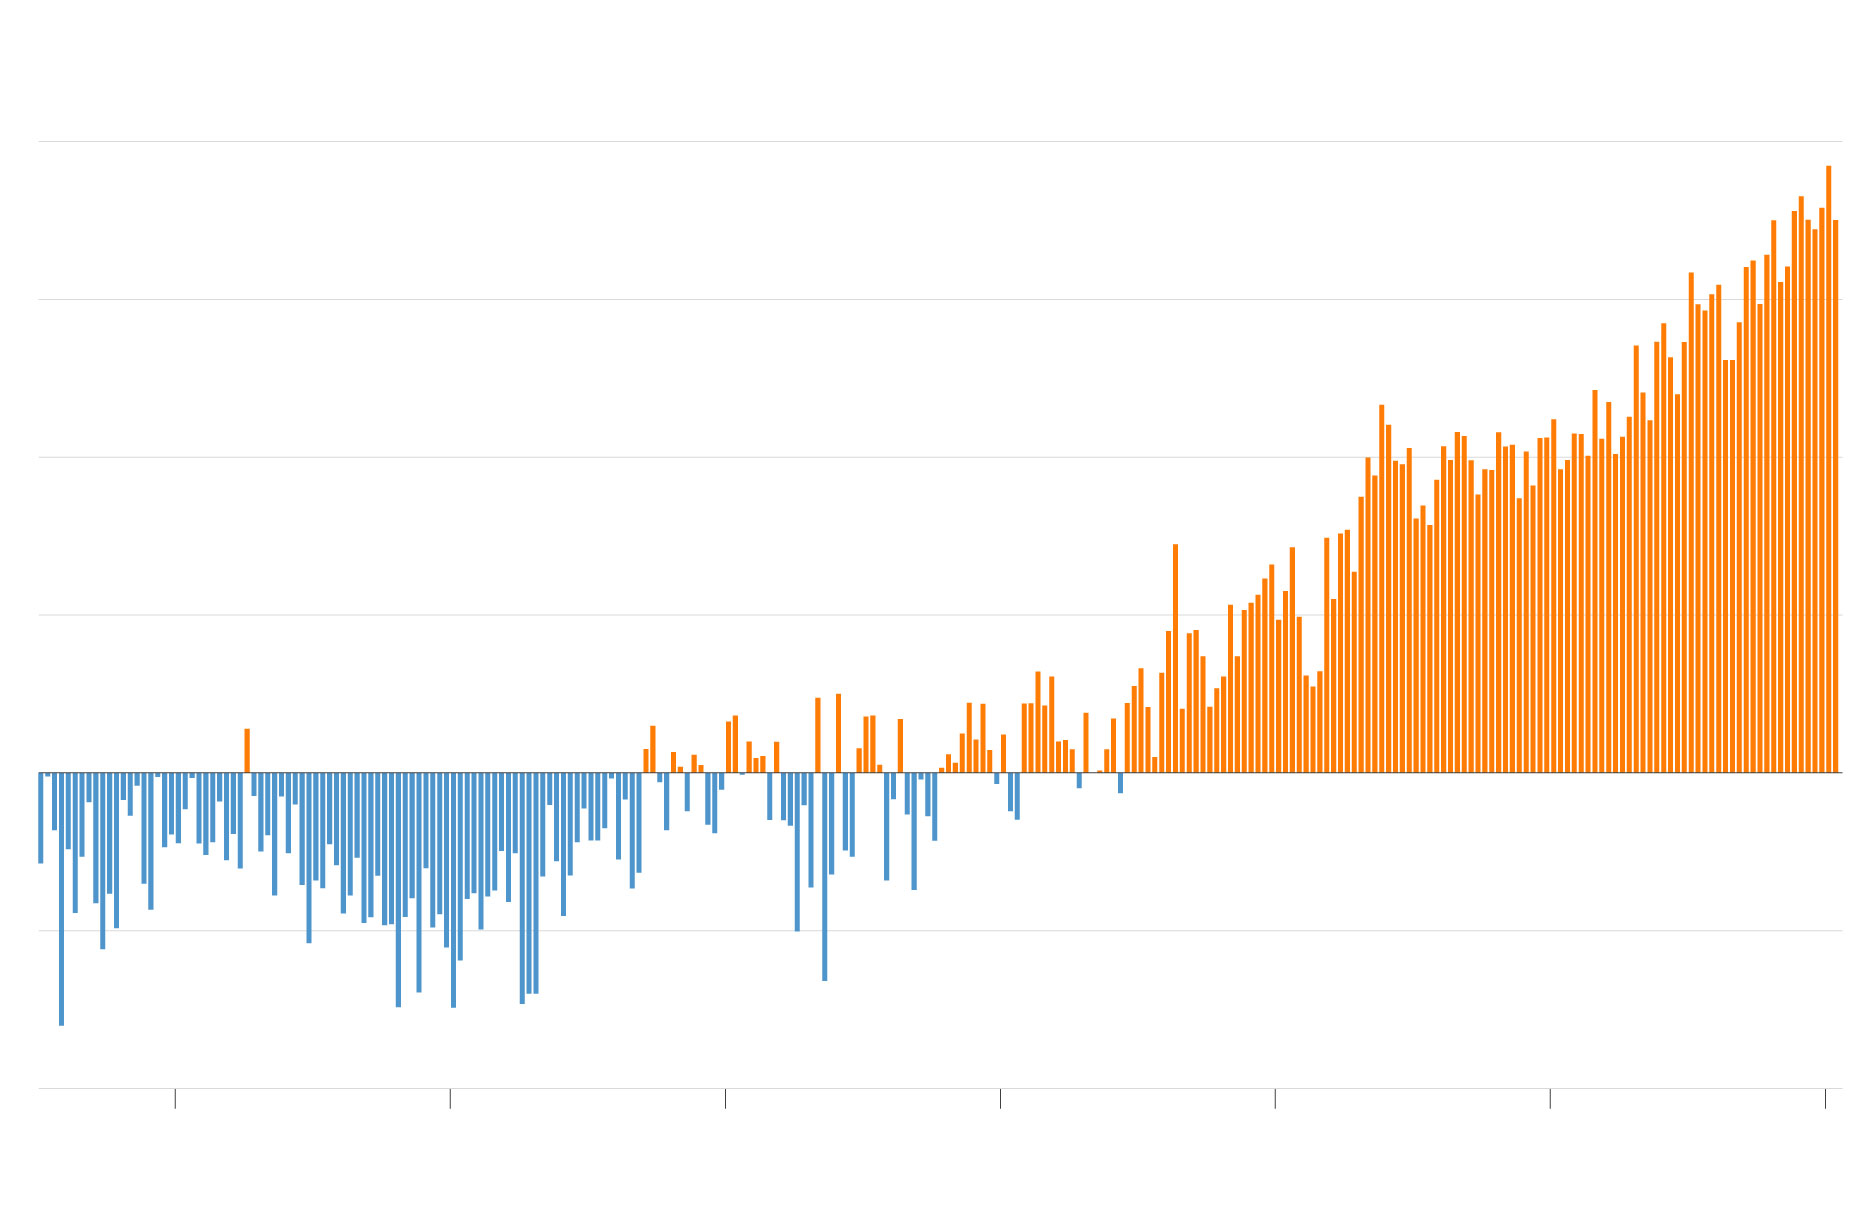
Amount of heat in the upper layer of the ocean, compared to the average from 1955-2006. Data is for the top 700 meters (2300 feet) of the ocean and given in 10^22 Joules.
20
15
10
5
0
-5
-10
1960
’70
’80
’90
2000
’10
’20
Source: NOAA
Amount of heat in the upper layer of the ocean, compared to the average from 1955-2006. Data is for the top 700 meters (2300 feet) of the ocean and given in 10^22 Joules.
20
15
10
5
0
-5
-10
1960
’70
’80
’90
2000
’10
’20
Source: NOAA
Amount of heat in the upper layer of the ocean, compared to the average from 1955-2006. Data is for the top 700 meters (2300 feet) of the ocean and given in 10^22 Joules.
20
15
10
5
0
-5
-10
1960
1970
1980
1990
2000
2010
2020
Source: NOAA
Amount of heat in the upper layer of the ocean, compared to the average from 1955-2006. Data is for the top 700 meters (2300 feet) of the ocean and given in 10^22 Joules.
20
15
10
5
0
-5
-10
1960
1970
1980
1990
2000
2010
2020
Source: NOAA

“We have relatively high confidence that storms will get stronger,” said Kossin. Both he and Knutson estimated the increase in the wind speeds to be between about 3% and 4% per degree Celsius of warming.
“But that is not what is really important,” Kossin said. The added heat in the oceans is “increasing the speed limit for storms,” raising the maximum intensity that storms can achieve.
“The stronger storms are getting stronger,” he warned, “and the stronger storms are becoming more frequent.”
In a study released earlier this year examining nearly 40 years of available satellite data, Kossin and his co-authors found that the probability of storms reaching major hurricane status (Category 3 or above with winds in excess of 110 mph or higher), increased decade after decade.
“The change is about 8% per decade,” Kossin said. “In other words, during its lifetime, a hurricane is 8% more likely to be a major hurricane in this decade compared to the last decade.”
Phil Klotzbach, a hurricane researcher at Colorado State University who monitors and analyzes hurricane trends across the globe, draws similar conclusions about how climate change is increasing hurricanes’ strength.
“The prevailing consensus is that we likely won’t see more storms in the future (maybe even fewer), but that these storms may be stronger,” Klotzbach said. “If you look at the (hurricane) trend since 1980 (when reliable data became available), there’s a huge increasing trend in Category 4s and 5s.”
With stronger storms, there’s also a greater chance for severe damage and destruction when hurricanes collide with towns and cities.
“Almost all of the damage and mortality caused by hurricanes is done by major hurricanes (Category 3 to 5),” Kossin said. “Increasing the likelihood of having a major hurricane will certainly increase this risk.”
Other variables — like the presence of El Nino and La Nina conditions – can also cause significant swings in how hurricanes form around the world. Because of this, scientists say more data is needed before we can say with certainty how climate change will impact hurricanes’ strength now and in the future.
Storms are rapidly intensifying more frequently
As human activity warms up the planet, the extra heat isn’t just confined to the ocean’s surface — it extends hundreds of meters deep, providing extra heat energy for hurricanes to use for fuel.
And as warming reaches deeper and deeper stretches of the world’s oceans, scientists believe that storms are more likely to undergo “rapid intensification.”
Rapid intensification is when a storm quickly gains strength – officially, a storm has undergone rapid intensification if its wind speeds increase by at least 35 mph over a 24-hour period.
“If you increase the speed limit, you make more room for the storms to strengthen, so it can intensify more quickly,” said Kossin.
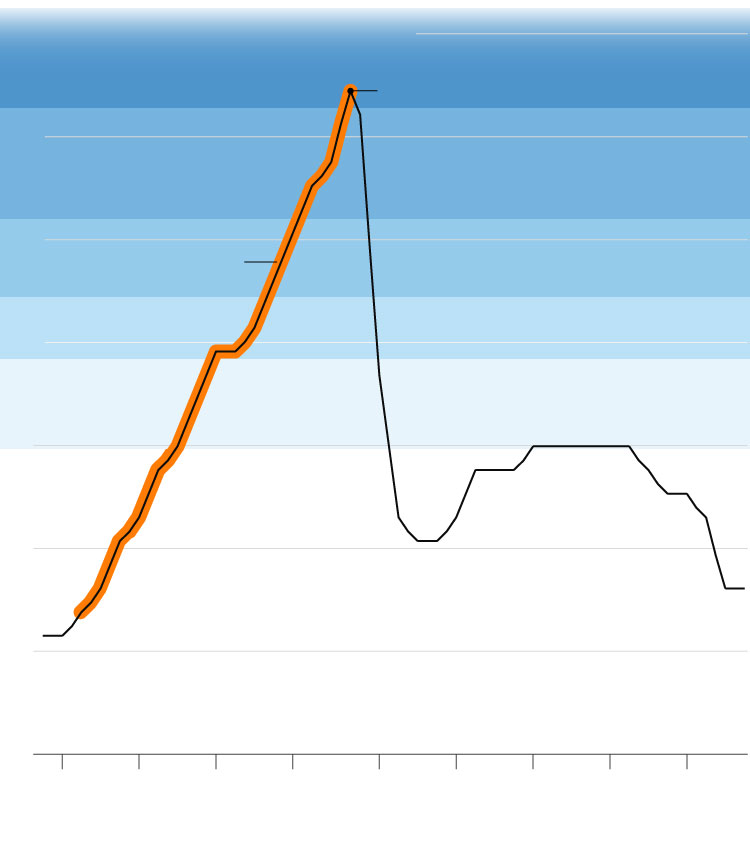
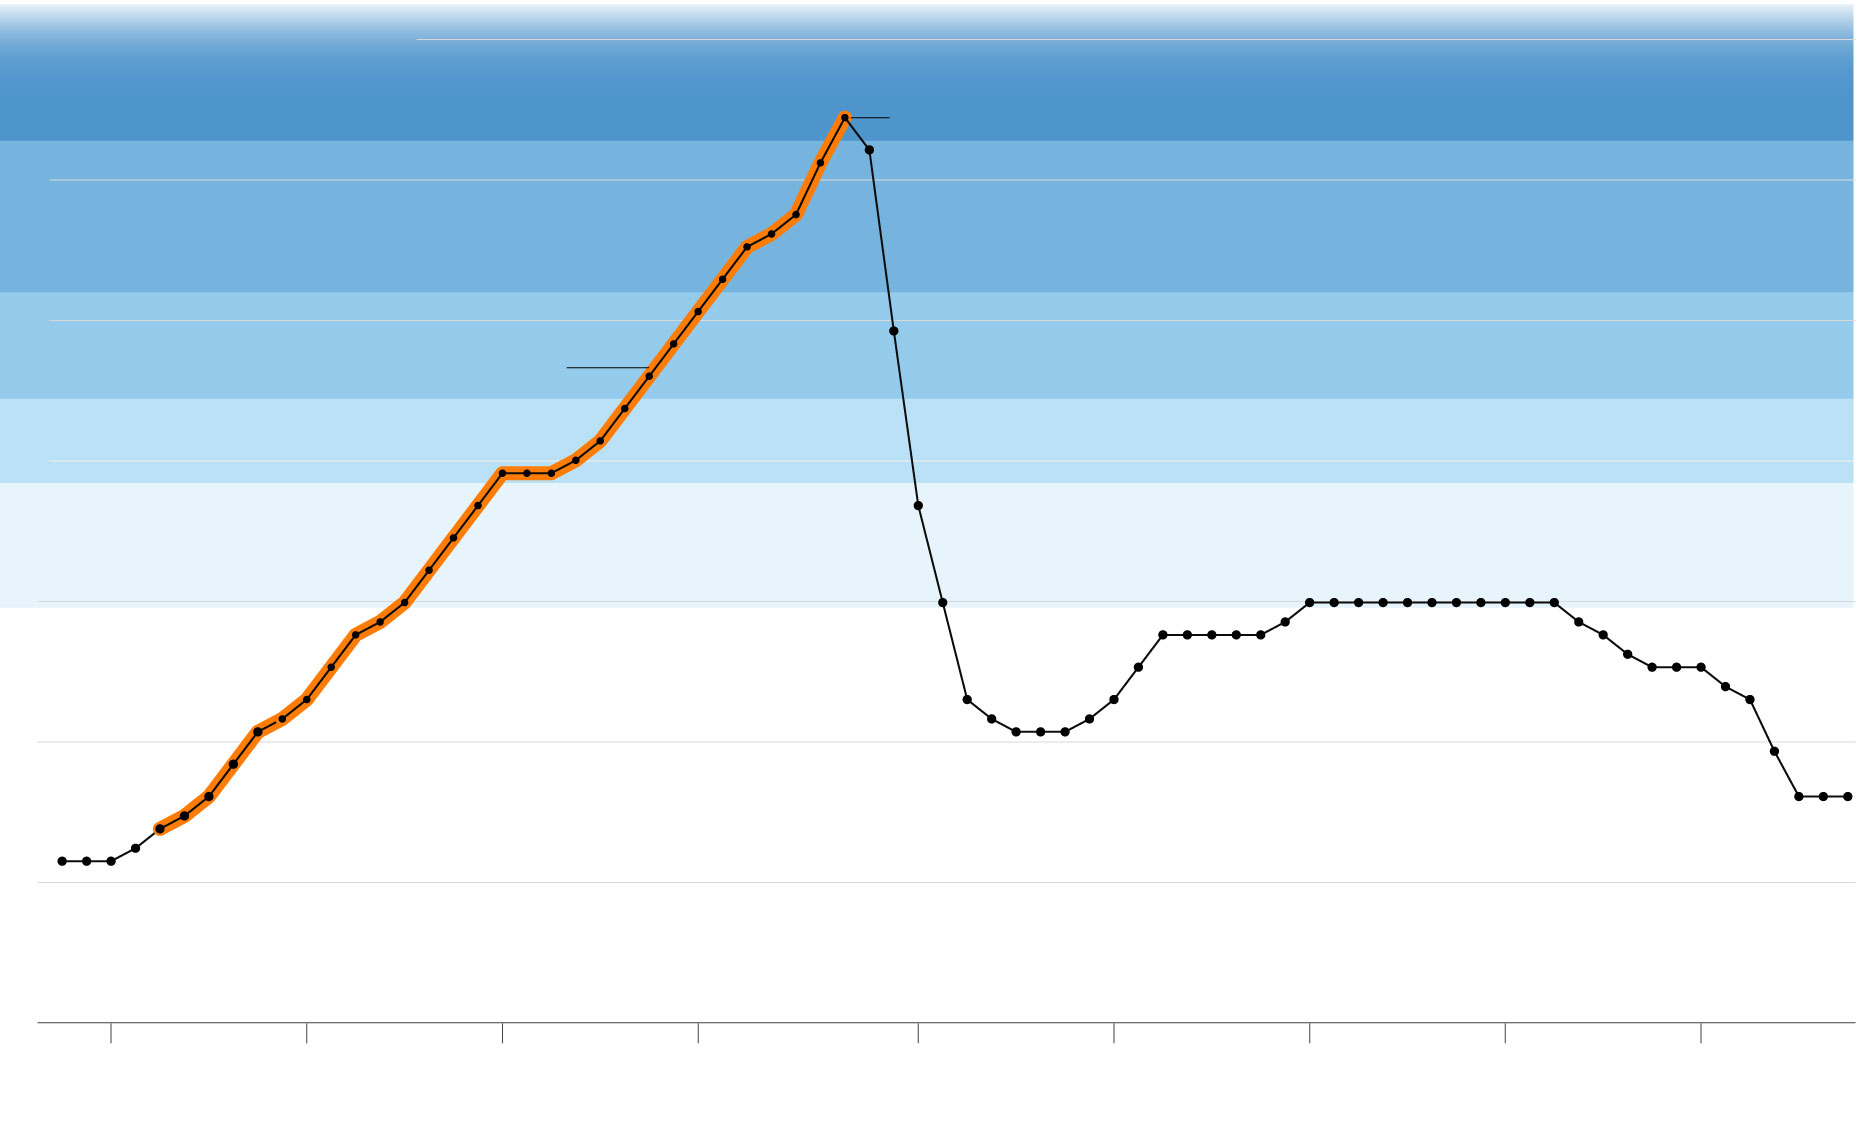
Hurricane Michael, which made landfall as a Category 5 storm on Oct. 10, 2018, underwent rapid intensification before striking the Florida panhandle.
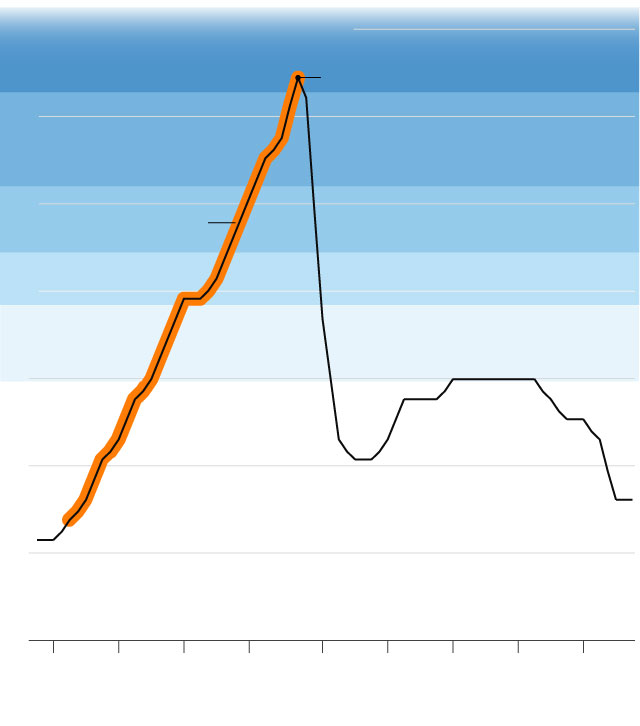
175 mph maximum sustained winds
Cat. 5
Landfall
150
Cat. 4
125
Michael
undergoing RI
Cat. 3
100
Cat. 2
Cat. 1
75
50
25
0
Oct. 7
9
11
13
15
Source: NOAA
175 mph maximum sustained winds
Cat. 5
Landfall
150
Cat. 4
125
Michael
undergoing RI
Cat. 3
100
Cat. 2
Cat. 1
75
50
25
0
Oct. 7
9
11
13
15
Source: NOAA
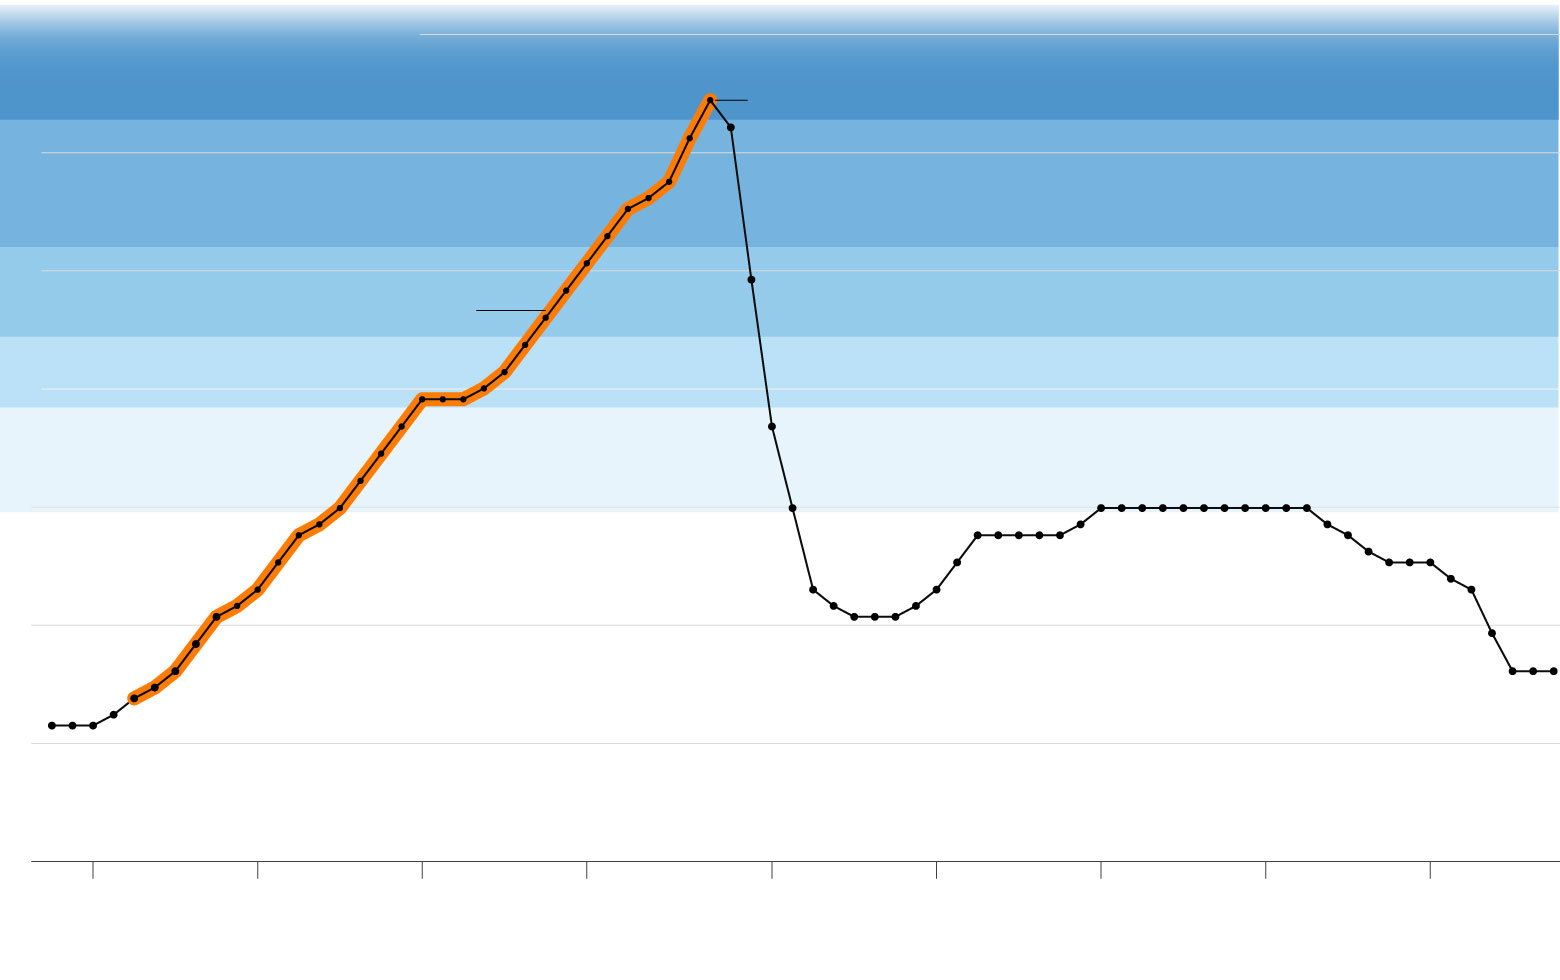
175 mph maximum sustained winds
Landfall
Category 5
150
Category 4
125
Michael undergoing
rapid intensification
Category 3
100
Category 2
Category 1
75
50
25
0
Oct. 7
Oct. 8
Oct. 9
Oct. 10
Oct. 11
Oct. 12
Oct. 13
Oct. 14
Oct. 15
Source: NOAA
175 mph maximum sustained winds
Landfall
Category 5
150
Category 4
125
Michael undergoing
rapid intensification
Category 3
100
Category 2
Category 1
75
50
25
0
Oct. 7
Oct. 8
Oct. 9
Oct. 10
Oct. 11
Oct. 12
Oct. 13
Oct. 14
Oct. 15
Source: NOAA

From satellite imagery, you can see how Michael’s eye quickly became more defined and organized as it approached the coast, a sign that the storm was gaining strength:
NOAA/CIRA
Three of the most damaging hurricanes to strike the US in 2020 — Hanna, Laura and Sally — all rapidly intensified before making landfall.
Then in November, Hurricanes Eta and Iota both rapidly gained strength before making landfall in Central America just weeks apart, with Iota becoming the strongest storm to ever hit Nicaragua. The fact that there were water temperatures warm enough to allow both storms to rapidly intensify this late in the season is a clear signal of global warming, Klotzbach said.
While some recent research has shown this trend, scientists say not enough historical data exists to say how much more common rapid intensification has become.
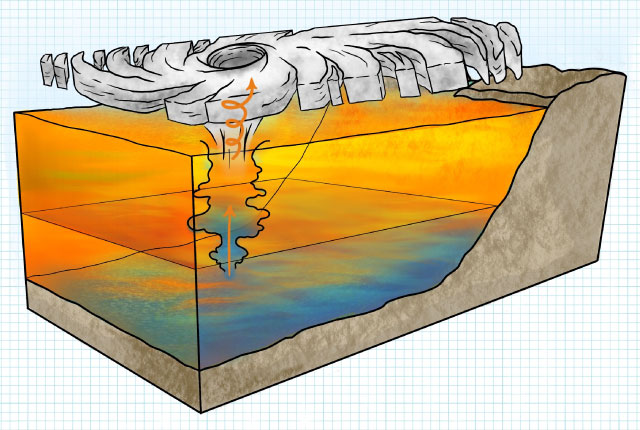
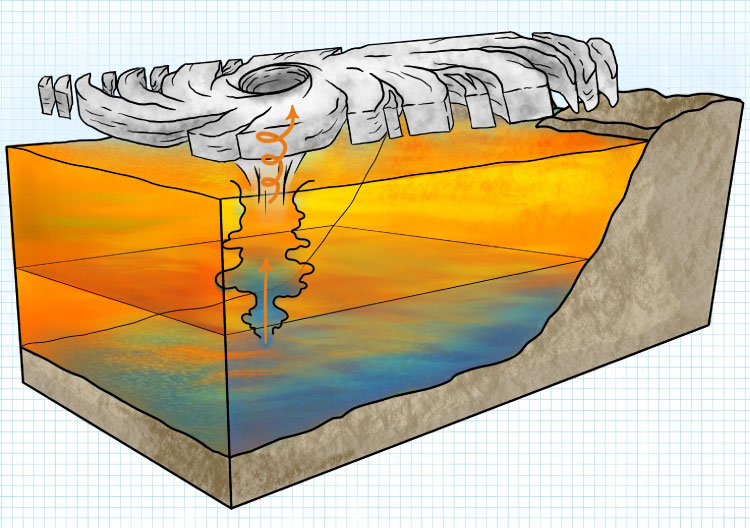
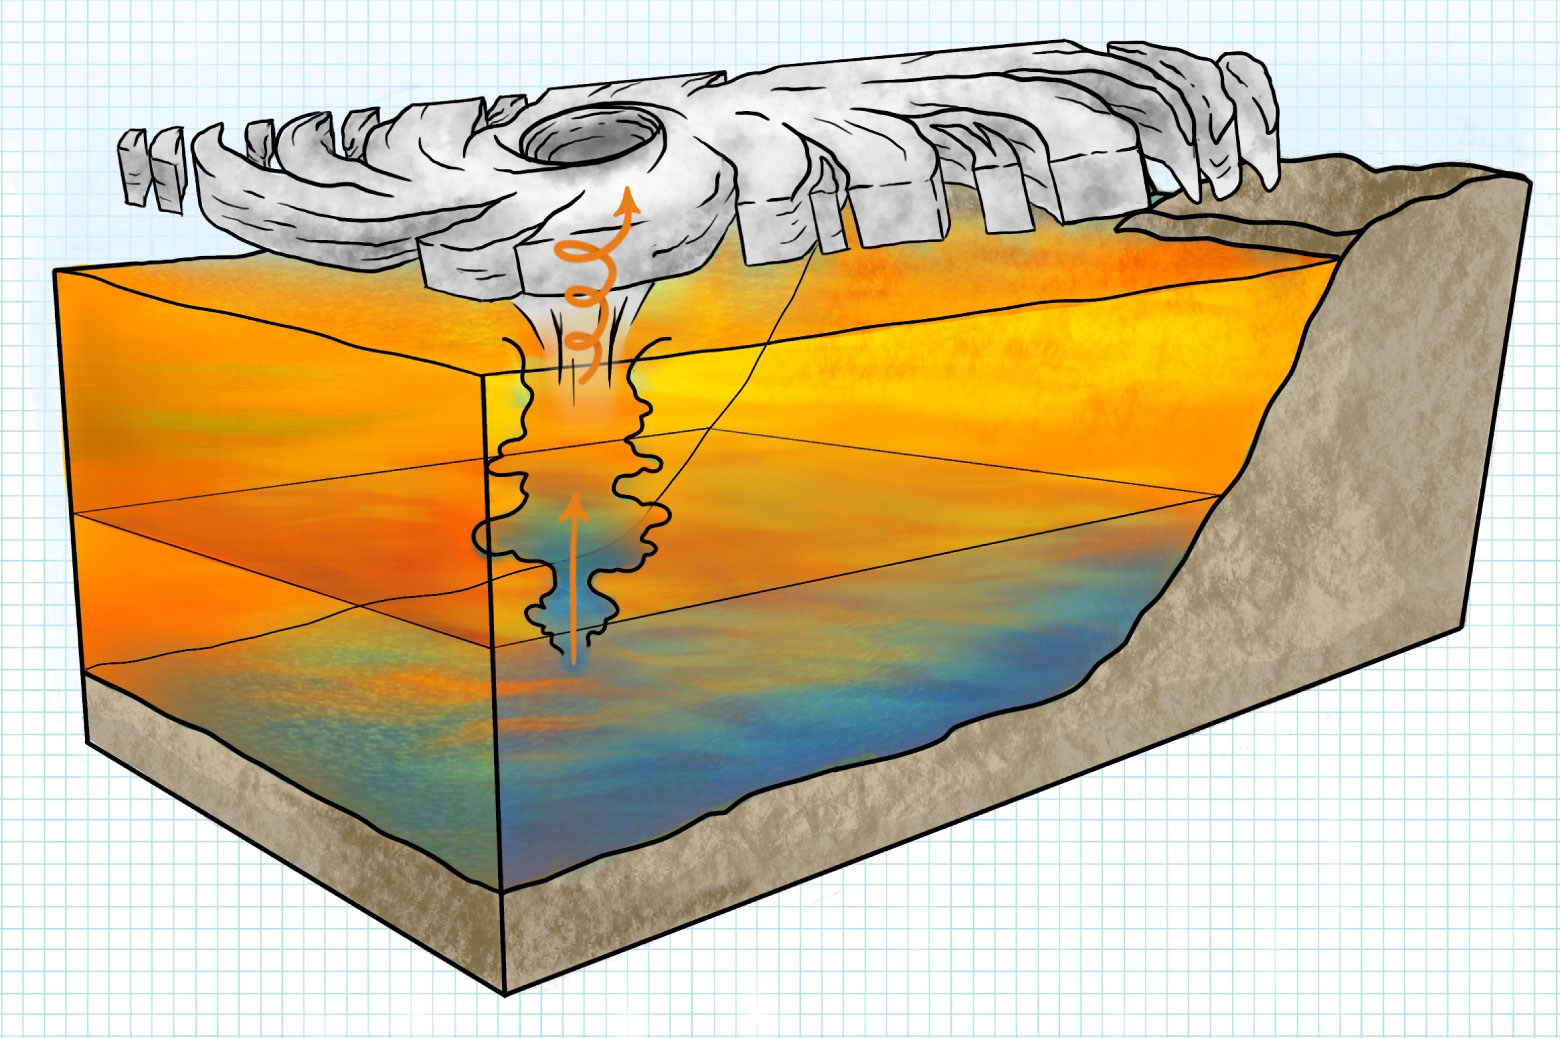
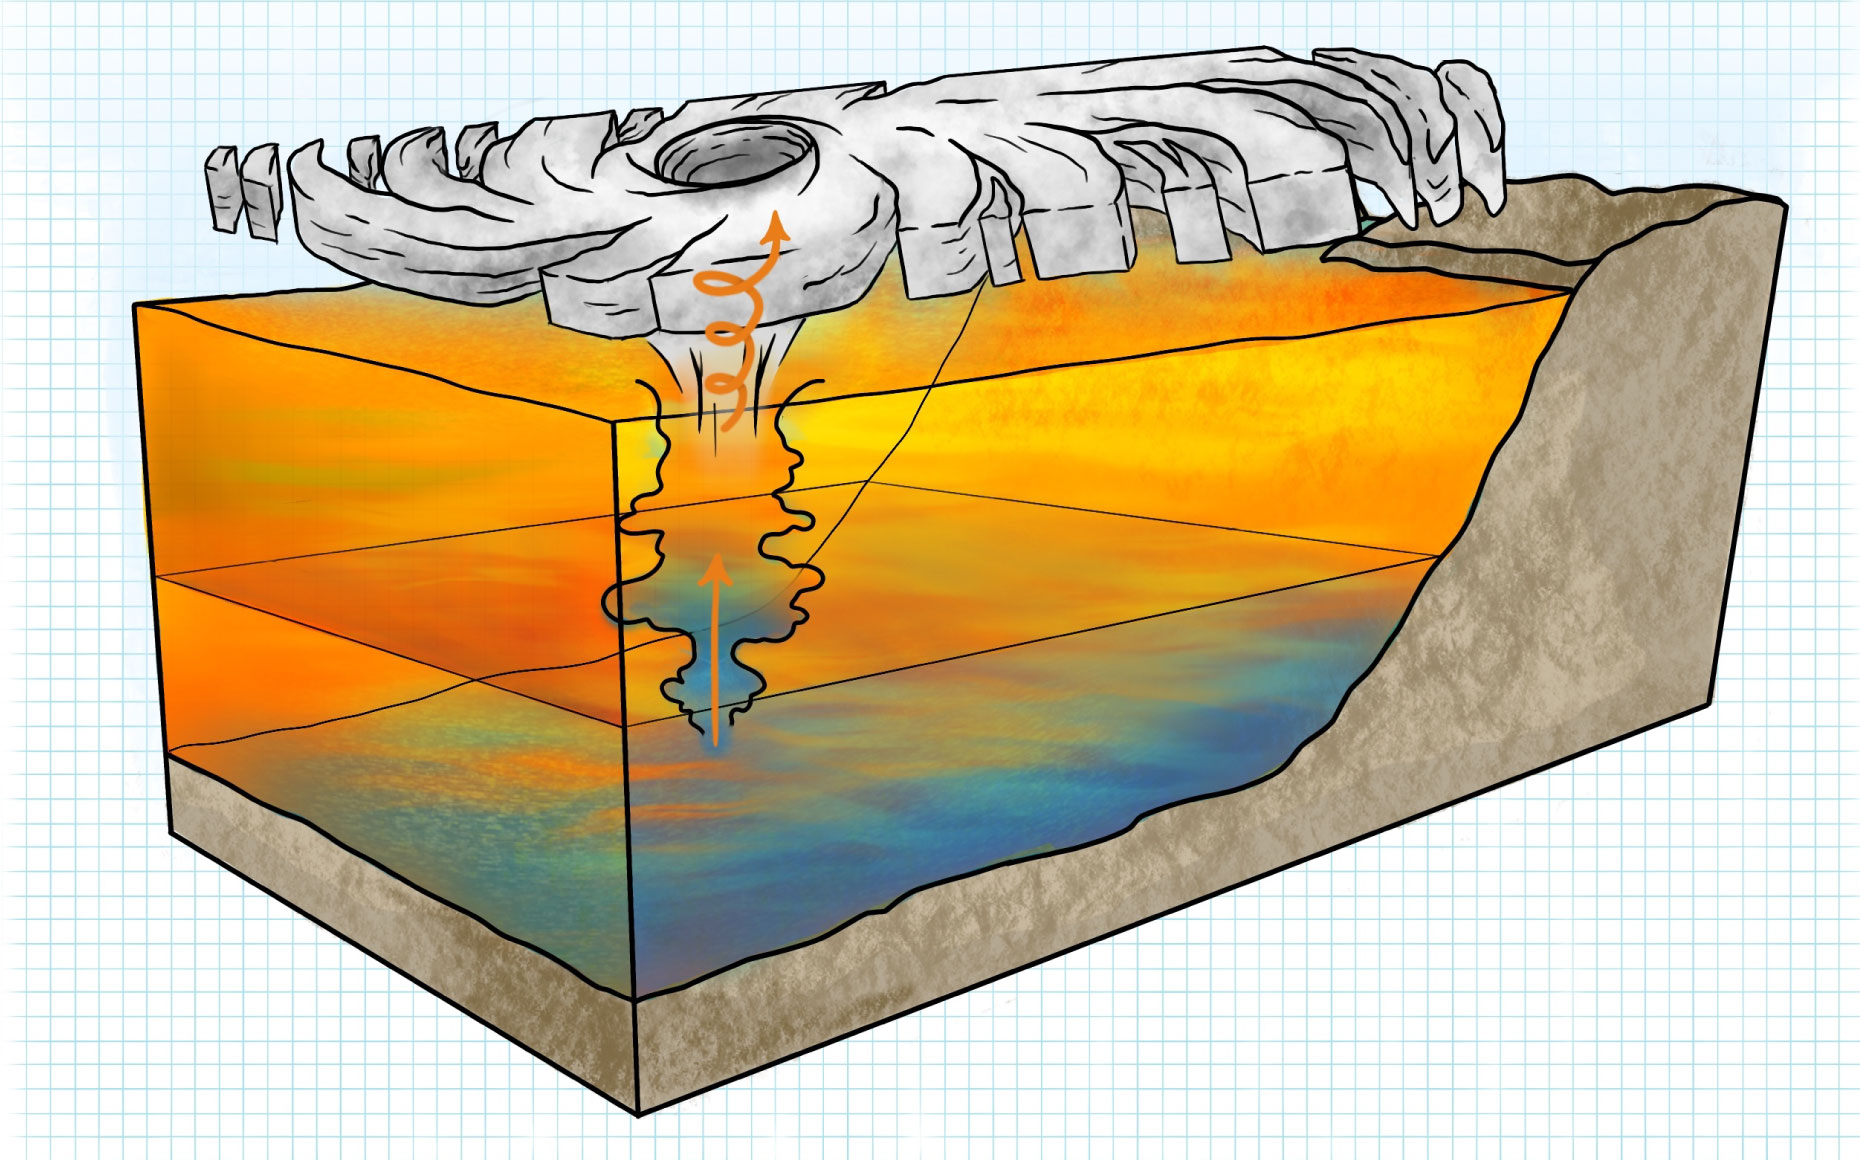
Warmer water
Cooler water
Warmer water
Cooler water
Warmer water
near the surface
Cooler water
below
Warmer water
near the surface
Cooler water
below

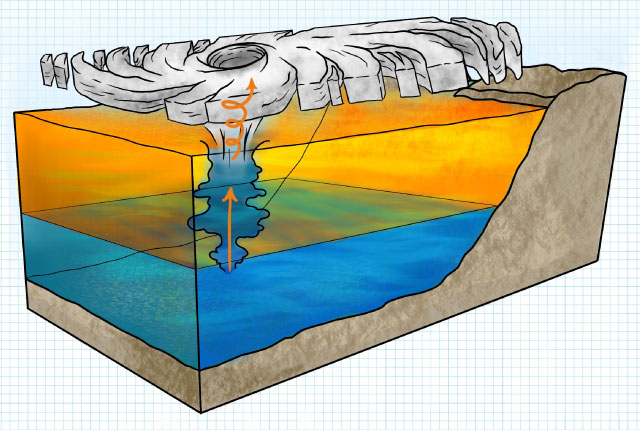
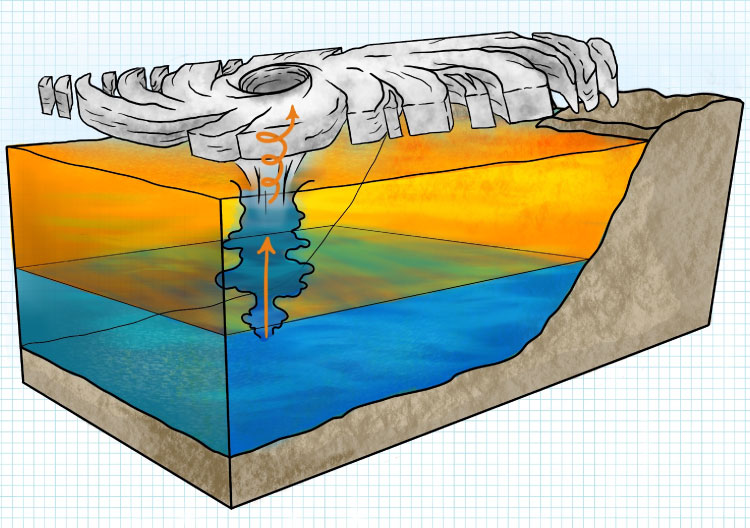
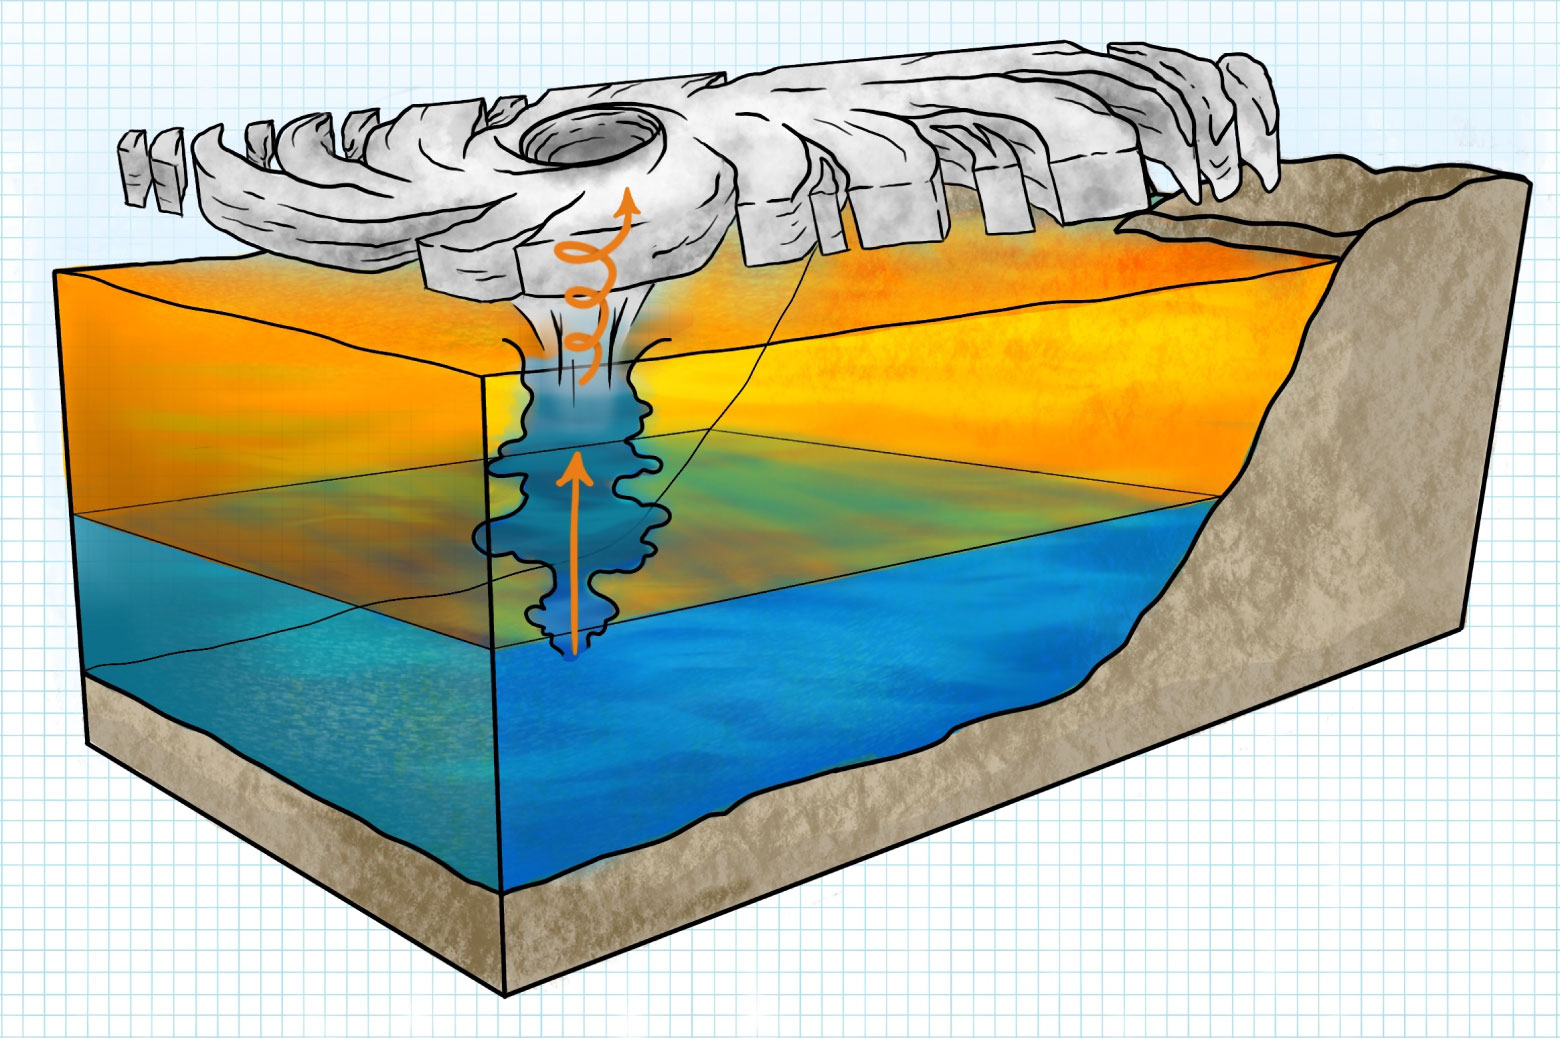
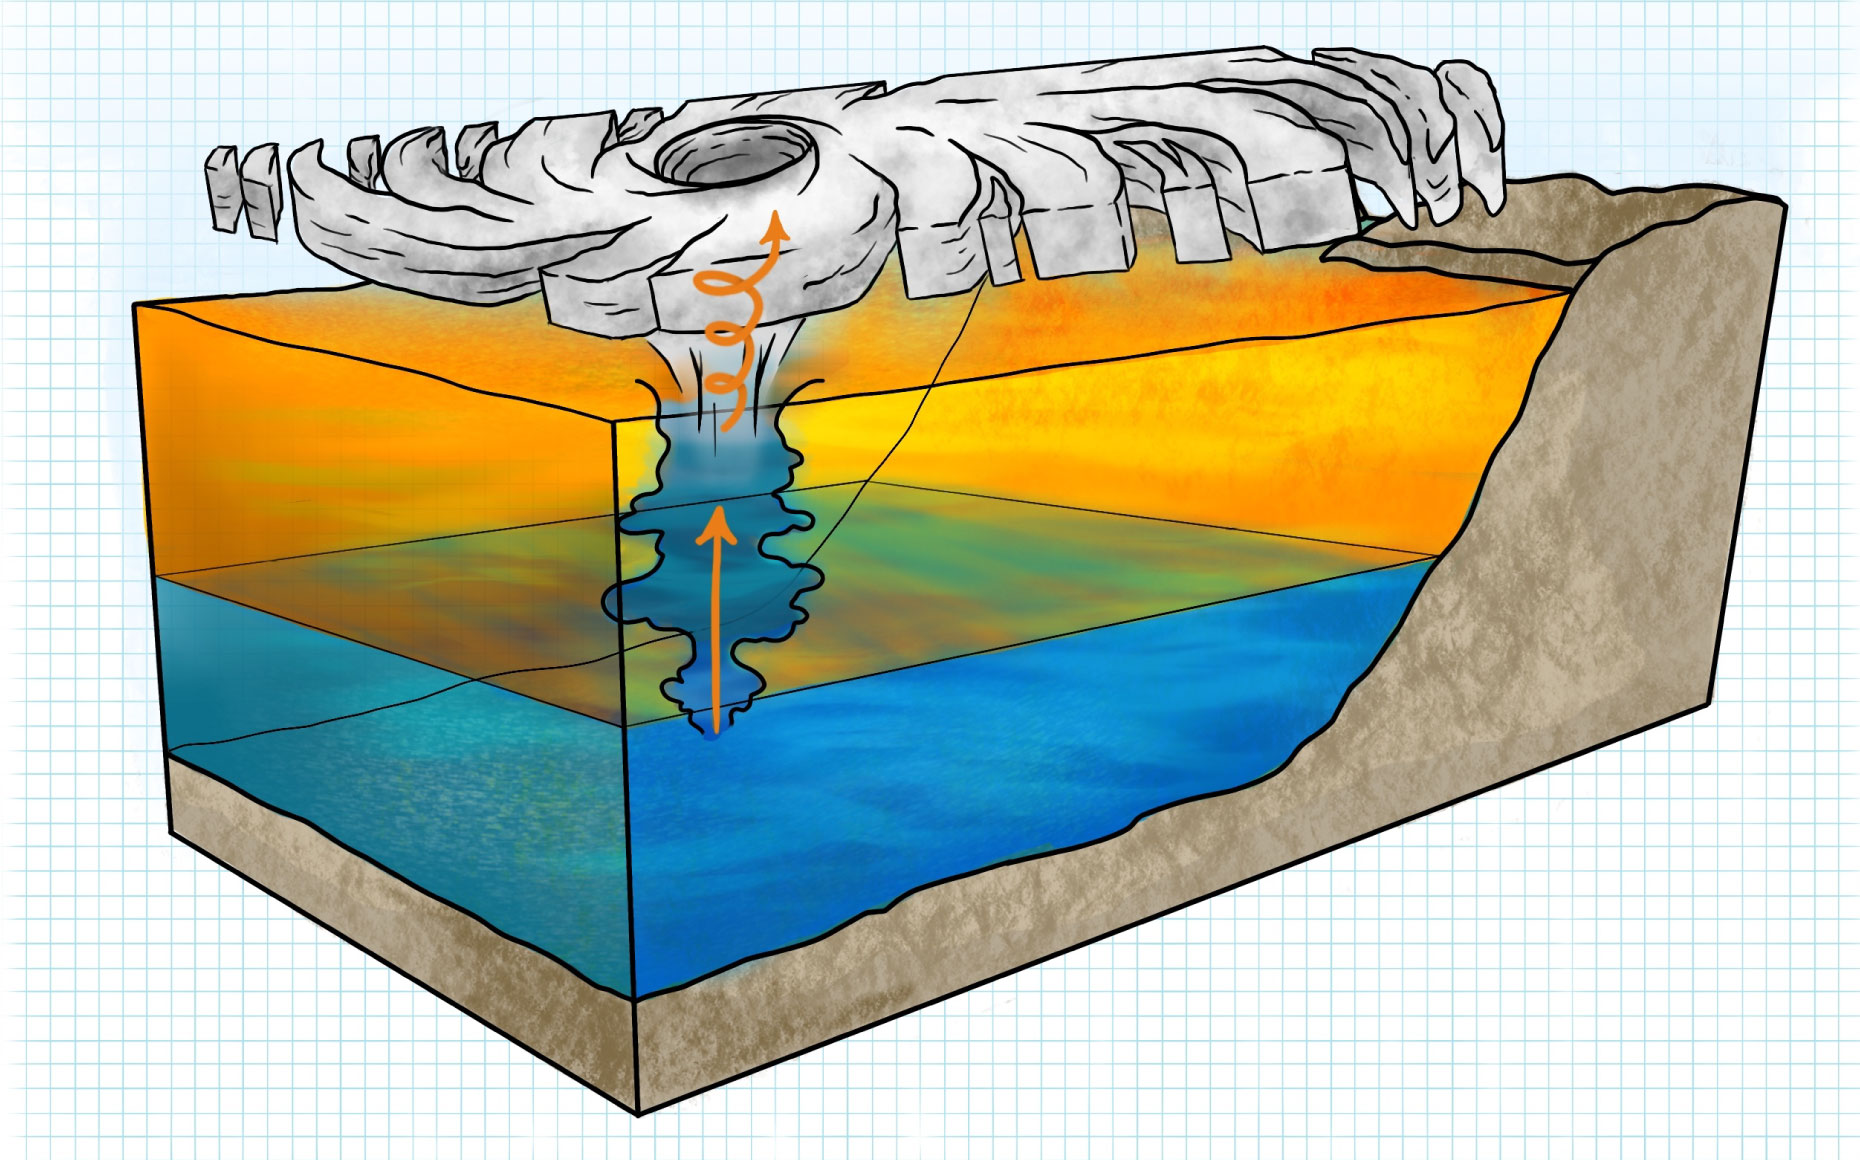
Hurricanes are fueled by heat energy from warm ocean waters. As a storm moves over the ocean, it pulls in energy from the water's surface.
Wind and rain churn up the ocean below a hurricane, causing cooler waters from the depths to mix with warmer, surface water. This tends to limit how much a storm can strengthen.
But as the planet has warmed, heat in the ocean now extends further below the surface.
All this extra heat gives hurricanes more fuel to gain strength rapidly.
Klotzbach also noted that while the data shows an increase in the number of storms that have rapidly intensified, it also shows an increasing number of storms have rapidly weakened — indicating the increases could also be a function of advances in the amount and quality of data we are now able to collect on storms.
“We used to observe storms less frequently and with satellites that had lower resolution, and consequently, we likely couldn’t measure rapid intensification as well as we can now,” Klotzbach told CNN.
More storms are reaching peak intensity at higher latitudes
To borrow a real estate adage, it’s “location, location, location” that also determines just how much damage a hurricane or typhoon can inflict.
An identical storm will produce much more destruction if it makes landfall in a major coastal city in the mid-latitudes – say New York, Shanghai or Brisbane — than if it slams into a sparsely populated coastline elsewhere.
Though scientists say more evidence is needed, some findings in recent years show that more storms are reaching their peak intensities closer to the poles, potentially putting more cities within range of a major hurricane landfall.
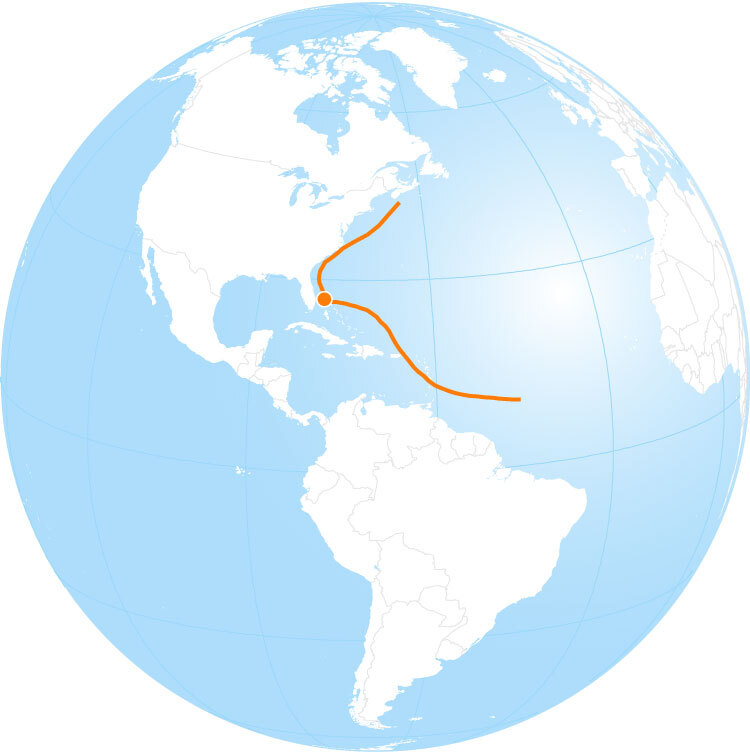
According to Kossin, who has published multiple studies on the topic, there is a growing body of evidence that there “has been a systematic shift in the storm track that is not easily explained by natural causes.” In the Northern Hemisphere, this means storms are tracking further north and in the Southern Hemisphere, further south.
“The tropics are expanding — so it seems to reason that the tropical cyclones would be able to extend further into the mid-latitudes,” Kossin said, “and when we looked at the data were able to see this shift.”
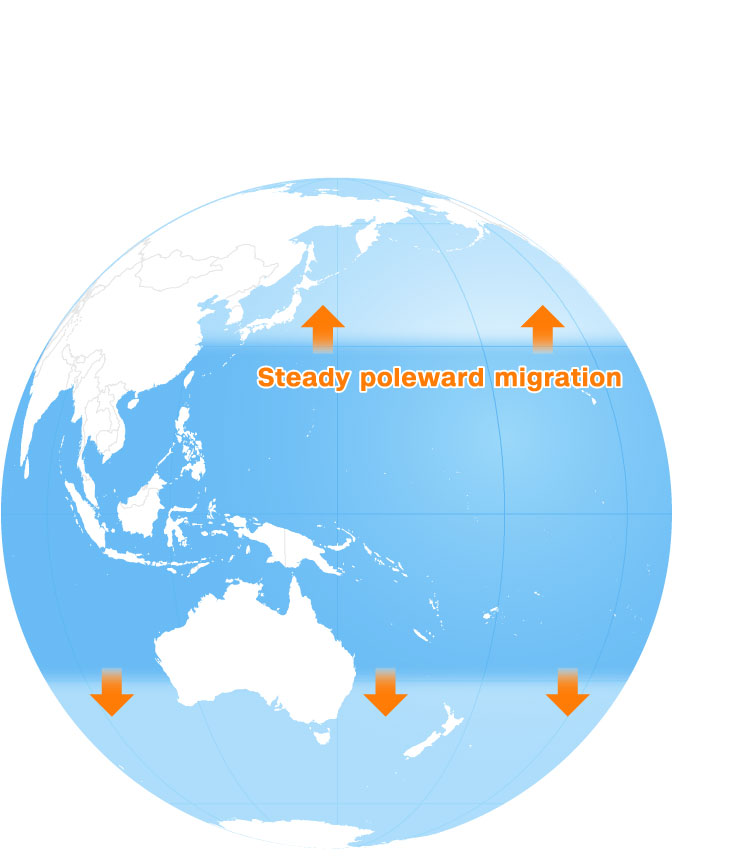
The Earth’s “bulging waistline” means warmer waters that fuel tropical storm formation are expanding poleward.
30°N
Area where strongest
cyclone activity is
typically observed
0°
30°S
The shift, which has been estimated to be about 30 miles per decade, has been very well defined in almost all the basins, including the western North Pacific, the southern Indian Ocean and the South Pacific.
This shift in where storms strike could have an even larger impact on the threats hurricanes pose than increases in storm intensity due to climate change, Kossin said.
Major cities that do not have a history of dealing with tropical storms, especially at or near peak intensity, could be seeing them on a more regular basis in future decades, Kossin said.
Heavily populated shorelines in northeastern China and Japan are seeing storms with 2 to 3 times the frequency they were in earlier decades, while low-lying archipelagos like the Philippines are seeing storms less frequently than we’d expect, he said.
The one place where hurricane tracking data hasn’t shown much of a northward shift is in the Atlantic Basin.
Most scientists, Kossin included, attribute this to some longer-term variabilities that are both natural and human caused. Kossin believes the Atlantic will likely see this poleward shift in the track of storms too, but so far, it has not materialized.
More storms are stalling. That’s a big problem
The slower a storm moves, the more time its winds and rain can inflict damage.
In 2019, Hurricane Dorian’s devastating crawl across the Bahamas slowed to 1 mph, slower than the speed at which most humans walk. The slowdown kept the island of Grand Bahama in Dorian’s eye for more than nine hours.
The lashing winds and torrential downpours from Hurricanes Harvey and Florence also slowed to a crawl on land.
As the planet warms, scientists say more and more storms appear to be experiencing this slowdown, increasing the amount of time locations in their path are exposed to dangerous conditions.
Between 1944 and 2017, 66 storms have stalled in the north Atlantic Basin, and nearly two-thirds of those occurred within the final 25 years of the study, suggesting a trend towards slower-moving storms, according to a 2019 study from Kossin and co-author Timothy Hall.
But the phenomenon isn’t just confined to the Atlantic Basin.
His 2018 study in the scientific journal Nature found that the forward speed of hurricanes decreased by 10% globally between 1949 and 2016, though there is some variation in different ocean basins.
The study also found a 20% to 30% slowdown over land areas affected by North Atlantic and North Pacific tropical cyclones, respectively.
The western north Pacific Basin, which sees the most storms annually, has also seen the most slowing, while storms in the northern Indian Ocean do not appear to be slowing down yet.
Overall, tropical cyclones have slowed more in the Northern Hemisphere, which is where a majority of storms occur each year.
There is considerable evidence that global summertime circulation patterns in the atmosphere are slowing as a result of global warming. Kossin believes this may also be putting the brakes on hurricane movement, but cautioned that the connection between climate and stalling is still unclear.
Some scientists think other variables may be at play.
Other natural climate variations — such as the Pacific Decadal Oscillation – can also influence hurricane formation over long periods of time.
This study did not account for these natural cycles, which could be behind much of the observed trend, said Kevin Trenberth, a senior climate scientist with the National Center for Atmospheric Research.
“It is far from clear that global climate change has anything to do with the changes being identified,” said Trenberth.