
Whether you go by the holiday or meteorological calendar, summer is on! That doesn’t only mean heat, it also means road trips to a lot of Americans.
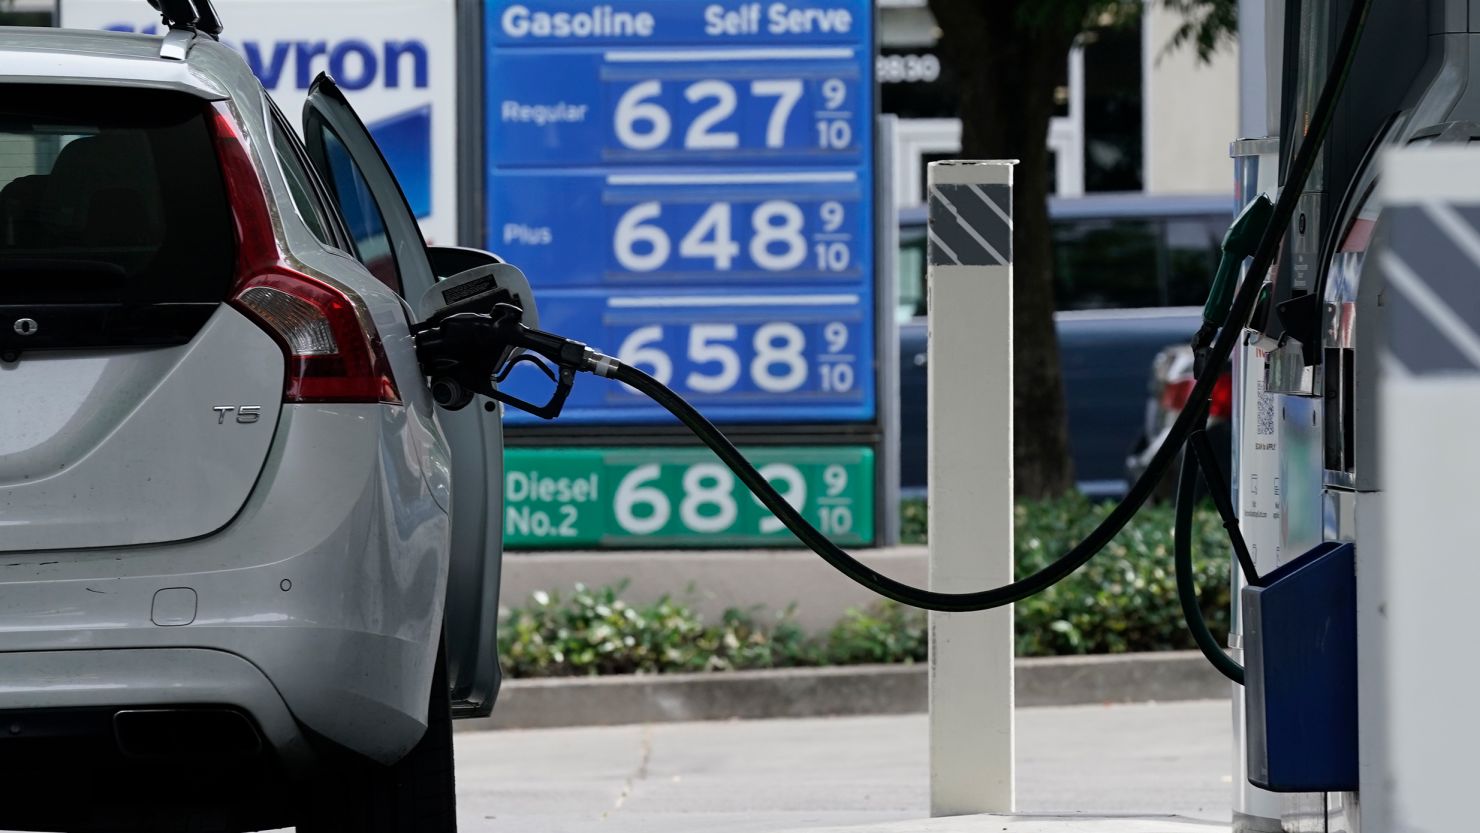
But over the last few months, folks planning out their vacations have been in for a rude awakening over the price of gas. The national average for a gallon of regular gasoline topped $4.70 for the first time ever this week.
On top of historic inflation, this is the environment Democrats face five months from Election Day. It could prove disastrous for them.
Economic indicators point to something very unusual in 2022
When you examine something like gas prices from a historic context, it’s best to look at price fluctuations. The public is likely to be far more forgiving of paying $4.70 a gallon if at this time last year they were paying $5.70.
The problem for Democrats is that at this point last year, the average price of regular gasoline was a little over $3 a gallon. That means gas prices are up more than 55% from 12 months ago. No other midterm cycle featured a rate of increase anywhere close to that five months before the election.
The closest was 37% in 2006. And since 1978, there’s been only one other midterm year (2018) when the gas price growth rate (in percentage terms) at this point in the cycle was in the double digits.
In fact, before this year, the average since 1994 for midterm elections had been a mere 5%. It’s about 0% when we include monthly data from 1978. This year we’re seeing something more than 50 points higher.
Perhaps not surprisingly, the two midterm cycles that saw the greatest percentage decrease in gas prices (1986 and 2002) were ones in which the White House party either picked up House seats or lost a minimal amount. Meanwhile, 2006 was a year in which the White House party (Republicans) lost 30 seats and control of the House.
Still, the relationship between gas price increases at this point in the midterm cycle and electoral results in November has been far from perfect. Gas prices were down at this point in the 1994 cycle, and the White House party (Democrats) lost a net of 54 House seats.
Monthly data is harder to get before the 1970s, but the yearly data paints the same picture: We’re dealing with something that we really haven’t seen before at this point in a midterm year.
Likewise, inflation (as measured by the Consumer Price Index) is historically high. There has been exactly one midterm in the last century (1974) in which the inflation rate (year over year) was at the same level or higher than it is right now.
The average at this point in midterm cycles over the past century has been about 3%. We’re at more than 8% now, or nearly triple that long-term average.
But like gas prices, the effect of inflation on midterm results has been far from predictable. Yes, the two years when there were the biggest inflation growth rates (1942 and 1922) saw losses of 44 House seats or more for the White House party.
The 1970 and 1978 midterm cycles featured inflation rates above 6% at this point, but the White House party kept its House losses at 15 seats or fewer.
Again, though, we’re dealing with something that is on the outer edges of what we’ve seen historically. I’m not sure we really know how voters will react.
Indeed, the way Americans feel about the economy as a whole is something without a lot of historical analogies.
Gallup’s latest poll shows that 85% of Americans view the economy as either in fair or poor shape. That’s the highest level in any Gallup measurement since April 2012.
The only other midterm since 1994 when so many Americans thought the economy was just fair or poor was 2010 – and the White House party (Democrats) lost 63 seats and the House majority that year.
Five months out, signs point to a big Republican year
Anyone who reads my columns knows I’ve been pretty high on Republican hopes this cycle. Those beliefs have been based on the macro political environment (e.g., the generic congressional ballot).
With redistricting complete in all 50 states, we can now see that the micro environment looks a lot like what we’d expect in a big GOP cycle.
Take a look at the latest House race ratings from the Cook Political Report and Inside Elections. These outfits rate individual House races on a scale ranging from “solid” to “likely” to “lean” for a given party to “toss-up.” Inside Elections has a “tilt” category for races in between lean and toss-up.
What you’ll see is a lot more Democratic-held seats that are vulnerable right now (i.e., only leaning toward their party or worse).
Since 2000, the number of vulnerable Democratic seats relative to Republican-held ones correlates strongly with the election outcome. If the election were held today, the average of those two outfits points to a Republican gain of about 25 seats in the House. This would give them close to 240 seats. That’s roughly on par with what happened in the 2010 midterms.
This all makes a lot of sense. Republicans have won the House majority in every midterm since 1938 in which they were ahead on the generic congressional ballot at this point.
Moreover, the cause of Democrats’ problems is pretty easy to identify: Everything we mentioned in the first half of this column.
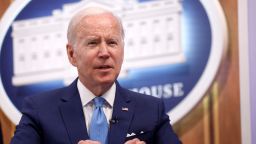
President Joe Biden’s approval rating when it comes to gas prices is about 30%. On inflation, it’s about 30%. His net approval rating on the economy as a whole stands at -26 points – tied with Jimmy Carter for the worst at this point in a midterm cycle since 1978.
This is a big problem for Democrats when voters list either the economy or inflation as their top issue, depending on how the poll question is asked.
In other words, everything we’d anticipate happening when certain economic measurements are at historically bad levels is happening.
The silver lining for Democrats is we’re still five months from the election. Things can change. For example, we don’t know how voters will respond if the US Supreme Court decides to overturn Roe v. Wade.
That said, time is running out. There are a lot of political science models out there that do a good job of forecasting election outcomes with just data available by the end of June of an election year. As election analyst Sean Trende has pointed out, a lot of election results are basically baked in by this point.
Democrats are going to have to hope that the unusual economic statistics we’re seeing this year lead to an unusual result.
For your brief encounters: Americans like that summer thermostat at 72 degrees
As I noted at the top, we’re already into summer, by a number of measures. The heat, which I find to be unbearable, can ultimately lead to discussions about what temperature to set the air conditioner at.
Well, polling shows that a plurality of Americans like to set that thermostat to 72 degrees, both during the day and at night.
If you find that statistic interesting, you should read my column on other fun summer statistics, including the fact that Americans prefer other seasons to summer.
Leftover polls
Support for same-sex marriage rises: Gallup’s latest poll finds that 71% of Americans say same-sex marriages should be valid. That’s the highest percentage ever recorded by the pollster. One of the only demographic groups where a majority aren’t in favor: weekly churchgoers (40%).
Students and in-person learning: A Pew Research Center poll of teenagers shows that 65% of them would prefer in-person learning once the Covid-19 pandemic is over. Just 9% want learning to be done online, while 18% prefer a mix of the two.
Covid-19 vaccine stability: An Axios/Ipsos poll from mid-May showed that 74% of American adults had received at least one shot of the vaccine. When taking into account the margin of error, this percentage has not changed since September.