Results and maps


Breaking down the 2022 vote


Guide to the 2022 midterms


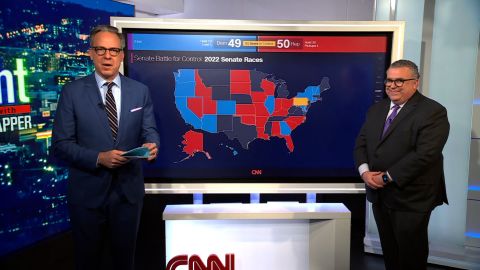


Senate race ratings
CNN’s Election Center uses pre-election race ratings for the Senate seats by Inside Elections with Nathan L. Gonzales, which provides nonpartisan analysis of campaigns for Senate, House and governor. This year, 35 of the 100 Senate seats were on the ballot.
House race ratings
CNN’s Election Center uses pre-election race ratings for all 435 House seats by Inside Elections with Nathan L. Gonzales, which provides nonpartisan analysis of campaigns for Senate, House and governor. Every two years, all 435 House seats are on the ballot. Heading into the election, Democrats controlled 220 out of 435 US House seats, while Republicans controlled 212 Seats, with three vacancies.
Primary election results
Explore the 2022 primary election results. Read seven takeaways from the primary season.
Redistricting
Updates on proposed congressional maps – and whether they might benefit Democrats or Republicans in the 2022 midterms and beyond.
CNN Poll of Polls: Tracking the race for U.S. House control
Ahead of America’s Congressional elections, polls frequently ask voters which party’s candidate they would support in their own House district, a question sometimes referred to as the “generic ballot.” The CNN Poll of Polls averages these results as measured by non-partisan, national surveys that meet CNN’s standards. Generic ballot polling provides a look at the overall political environment, but since members of Congress are elected from individual districts, a party’s share of support in such a national poll may not directly correlate to the number of seats they win in the U.S. House. A close divide in generic ballot preferences often signals Republican gains in the House. See generic ballot polling over time
CNN Poll of Polls
| Democrats | |
| Republicans |
Date Range: 10/24-11/02
CNN Poll of Polls: Biden poll tracking
An average of recent polls can often paint a more reliable picture of how the public views the president than a single poll can. The CNN Poll of Polls tracks President Joe Biden’s average approval and disapproval ratings in national polls. It includes the most recent results on this question which meet CNN’s standards for reporting and which measure the views of all US adults. The CNN Poll of Polls does not have a margin of sampling error. See Biden’s approval rating over time

CNN Poll of Polls
| Approve | |
| Disapprove |
Date Range: 03/21-04/12
Politics resources